We all know that the Shanghai Composite Index has seen massive volatility with the media dubbing August 24th as China’s Black Monday with the Index falling 8.5% and then a further 7.6% on the 25th.
So I thought it would be interesting to look at how a USD Interest Rate Swap trade performed over this period and specifically at the margin requirements of a cleared swap.
USD Swap Rates
Lets take the period 18 Aug to 31 Aug 2015 and look at 30Y Swap Rates.
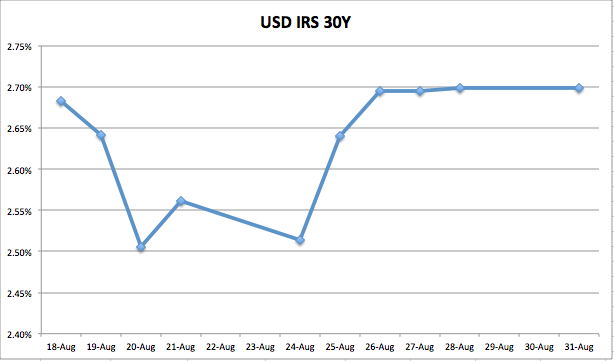
Showing that the rate:
- Closed on 18 Aug at 2.68%
- Fell steeply by 13.6 bps on 20 Aug to 2.51%
- Rose steeply by 12.6bps on 25 Aug to 2.64%
- Ended on 31 Aug at 2.70%
So a few big move days with rates bouncing right back to just above those at the start of the period.
Hypothetical Swap trade
Now assume that a Client traded a Pay Fixed 30Y Par Swap of $100m notional, Cleared at CME on 18 Aug.
What margin would the Clearing House require from the FCM and the FCM need to get from its Client?
Using CHARM we can answer all of these questions, using either the GUI or even more conveniently the API.
MTM and VM
Now this Swap trade has a DV01 of $208k, meaning it will gain $208k for every 1bps rise in swap rates.
We can calculate the daily MTM and derive the Variation Margin as the day to day change.
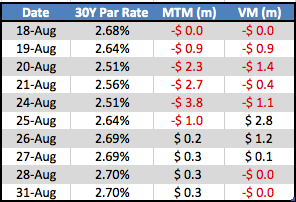
Showing that:
- The trade lost money on each of the first 4 days
- At the worst we were down $3.8m in our account
- And on 3 separate days had to post $1m
- Then on 25 Aug, there was a significant bounce
- (Lets assume we did not decide to cut and run on the 24th)
- We gained $2.8m on this day the 25th
- Continuing next day with a further $1.2m gain
- Ending with a small profit of $300k on 31 Aug
Volatile to say that least.
Showing that we needed to have decent liquidity to post the required cash VM each day to our Clearing Broker. (And assuming they were not so super friendly as to give us a grace period of 5 days, ISDA CSA’s anyone?)
Initial Margin
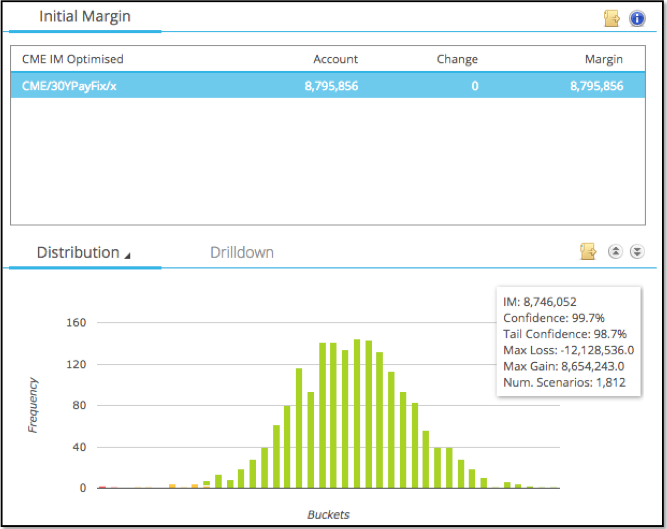
And what of the Initial Margin.
Using CHARM we can calculate this on 18-Aug as $8.8 million.
Now we could run this in the GUI for each of the next 9 business days.
But much more conveniently we can use the CHARM API.
CHARM API
A simple RESTFull API that can be quickly mastered and used in anger by an end-user using a simple scripting language like Python and with no knowledge of complex languages like Java or C#. (Who has time for that these days :-))
Lets step thru a brief 2 min tutorial.
We need a URL that does what we want.
- url = ‘http://test.charm.clarusft.com/clarusft-web/rest/api/charm/MarginHistory.csv
We create some parameters as inputs to our calculation request.
- whatIfRequest={}
- whatIfRequest[‘numDaysHistory’] = 10
- whatIfRequest[‘marginMethodology’] = ‘CME’
- whatIfRequest[‘tenors’] = ’30Y’
- whatIfRequest[‘templates’] = ‘Swap:Vanilla:USD-LIBOR’
- whatIfRequest[‘notionalSize’] = 100000000
- whatIfRequest[‘flowDirection’] = ‘Payer’
- whatIfRequest[‘houseClient’] = ‘Client’
We make the request.
- results = requests.post(url, data=json.dumps(whatIfRequest), headers=headers, auth=(…))
We output the results.
- print (results.text)
Thats all.
If you want to know more on the API, please contact us and no need to have your tech developer on the call to go into heavy duty programming stuff like what version of so and so is needed and how to install and ….
I digress, back to the results, formatted to make easier to read in a blog.
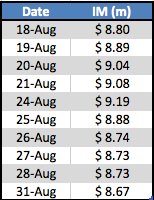
Showing that the Initial margin was:
- $8.80 million on the first day
- We would have to post this in cash or securities to our Clearing Broker
- It increased slightly by $400k or 4% up to $9.19 million on 24 Aug
- Drifted back down to $8.67 million on the last day
So pretty stable and much larger than the largest 1-day daily move of $2.8 million in VM, just as we would expect, given the Clearing House needs to be covered in the event of default and using extreme 5-day moves observed in a historical period of 7 years or more.
Why does IM Change?
Now given the 5-day market moves over this period are not big enough to impact the Tail Loss of our distribution, why the change in IM?
Well this can be explained by looking at a table of DV01 alongside IM.
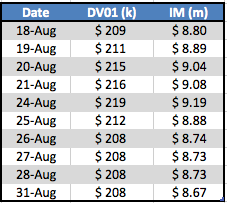
Showing that DV01 increases for he first 5 days, in-line with IM and then decreases.
So a small increase in the DV01 risk results in a commensurate increase in IM. All very sensible.
And the increase in DV01?
Well on a Pay Fix Swap, we are short convexity, because risk increases as rates go lower (as they did over the first 5 days) and we lose more and more money. The move lower has to be large enough to offset the fact that our DV01 will decrease with time (because we have fewer days left until maturity) but that would only happen over a much longer period than 10 days.
In our case rates move bounced back up and risk went back to what it was at the start.
So there you have the IM change explained.
Summary
USD Swap Rates moved down significantly and back up over the Aug 18-31 period.
A 30Y Pay Fixed Swap, entered into on 18 Aug, lost money for 5 days and then made it all back and more.
The daily VM swings of $1m or more, meant we needed to be liquid to meet cash margin calls.
IM also increased over the 5 days as the trade is short convexity.
The CHARM API provides a convenient way to run margin analytics over many days.
China’s Black Monday did not make a notable impact on the USD Swap market.
That’s all.
Except to say that Friday 4 Sep is the US Payroll report.
Might lead a move one way or the other.
Fingers crossed my 30Y trade does well.