- What could cause a Rates CCP to lose €100m from the Default Fund?
- We look at 10y IRS in NOK vs SEK.
- We find that liquidity add-ons prevent very large positions from being under-margined.
- Nevertheless, we present a scenario that causes a €74m loss.
- And then we explain why we really shouldn’t worry about it!
Following on from Amir’s blog last week, Default at Nasdaq Clearing, I went on to read some follow-up thoughts from Craig Pirrong, aka Streetwise Professor. His comments got me thinking – would a similar default be possible in a different asset class? Specifically, would it be possible in Rates markets?
CHARM Margin Optimisation
Margin models at Rates CCPs tend to be based upon historic look-backs, and we generally judge the likelihood of something happening in the future based on whether it has happened before. Our risk software, CHARM, includes a number of different margin models.
It was moves in power spreads (Nordics vs Germany) that caused the €100m hole in the Nasdaq default fund. Can we imagine a scenario that could cause a €100m hole in a default fund at a Rates CCP? Yes. How? Read on….
But first, I just want to clarify that I’ve seen daily moves of “17 times normal” quoted as the cause at Nasdaq, but I won’t use that here. I do not think it is credible to assume that moves in one asset class can translate to another.
Instead, we will use CHARM, our Margin Optimisation solution, to run margin and risk calculations to look at some hypothetical scenarios.
Spreads are a killer
Keeping with the Nordic theme, I’m going to take a look at Rates spreads in 10y NOK vs SEK IRS. This has the following advantages for this blog:
- It’s not very volatile.
- It didn’t move when Lehmans went bust.
- They are not emerging markets, where risk limits tend to be lower.
10y NOK IRS
Let’s start simple, with the margin for a standalone 10y NOK payer IRS at a major Rates CCP. We will use a risk size of €100k DV01 – which in this case equates to a NOK notional of NOK1bn for a 10 year trade.

- Initial Margin Required (in Euro equivalent) is EUR2.29m.
- Using Expected Shortfall, a more conservative measure that Value-at-Risk, as it is an average of the largest tail losses beyond a selected confidence level, that we have witnessed for this trade.
- With a risk of €100k DV01, that means a move lower in rates of 22.9 basis points is covered by the Initial Margin.
- That’s consistent with the biggest moves we’ve ever seen in NOK IRS – rates have moved down by ~24bp in the past, and up by ~34bp in the most extreme scenarios.
10y SEK IRS
Now for standalone 10y SEK receiver IRS at a major Rates CCP. We will use a risk size of €100k DV01 again – which in this case equates to a SEK notional of SEK1.1bn for a 10 year trade.
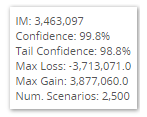
- Initial Margin Required (in Euro equivalent) is EUR3.46m.
- Again Expected Shortfall, so the worst tail loss scenarios that we have witnessed for this trade.
- With a risk of €100k DV01, that means a move of 34.6 basis points is covered.
- The worst case loss was €3.7m, whilst the best ever gain was €3.9m. So let’s say the biggest moves we’ve ever seen are between -37 basis points and + 39 basis points.
No €100m Hole To See Here
For these trades, you can see how securely margined they are:
- Even if rates moved by 50 basis points – such as we saw for USD rates or EUR rates during crisis times – the potential loss to a default fund would only be 25 basis points, or around €2.5m. This is a long way short of blowing a €100m hole in the default fund!
Massive Trades
What if I tried to trade huge amounts of risk?
- There are liquidity add-ons that ramp up very quickly for large positions, creating additional Initial Margin requirements. These tend to cause margins to increase exponentially as the size of the risk position ramps up beyond normal market size.
- For example, to cause a €100m loss, based on a 50 basis point move, we would need to have a position of €2m per basis point.
- But Initial Margin doesn’t scale in a linear manner. The IM amount for €2m in DV01 is not simply €50m. The liquidity add-ons that a Rates CCP applies would make this around €73m. Meaning that this hypothetical 50 basis point move now “only” leaves us short of €25m in Initial Margin.
Just to underline the above point:
- If I quadruple the size of the position, and traded NOK100bn in 10 years, my Initial Margin would be €608m! This is around triple the IM expected for a normal market size.
- If Rates moved by 50bp, my PnL on NOK100bn 10 years would be around €500m for this position.
Conclusion? Liquidity add-ons work at a single CCP. FCMs should have a duty with their clients to make sure that they are not putting on large positions at every CCP.
Our solution, CHARM, is ideally suited to monitor, manage and optimise margins for both FCMs and their clients – including massive trades!
10y NOK IRS vs 10y SEK IRS
What happens to the Initial Margin when we combine the two positions? i.e. I trade the spread NOK vs SEK:
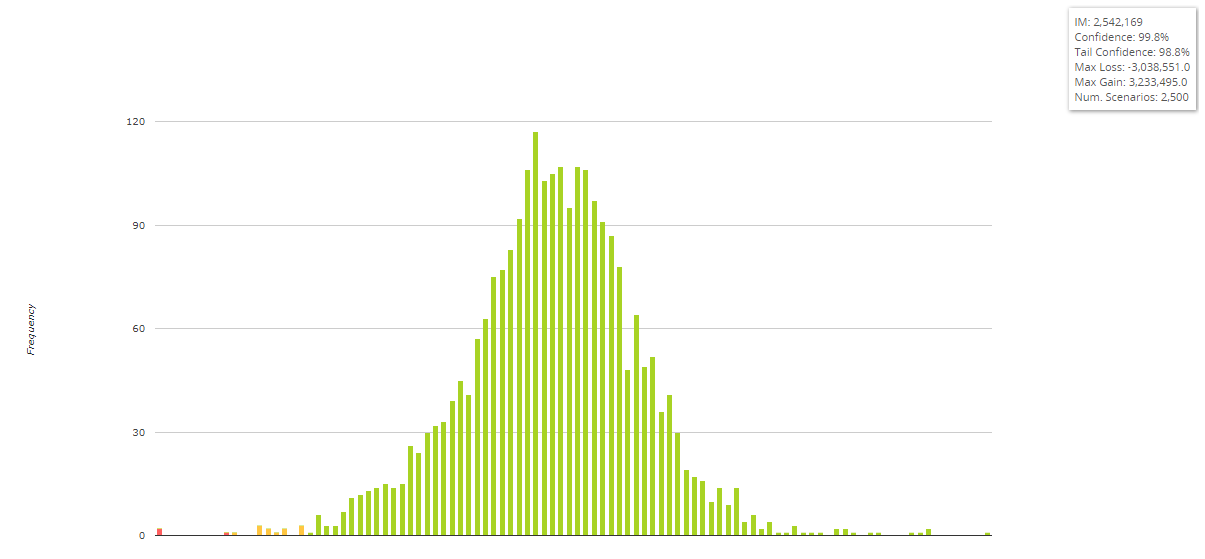
- Initial Margin Required (in Euro equivalent) is EUR2.5m.
- This is less than the two outright positions combined; historically, SEK and NOK rates have moved together.
- However, even though we tend to think of the spread as less volatile than the outright NOK IRS, this IM amount is actually HIGHER than a standalone NOK IRS position.
- The tail events are far more diverse. The worst case loss was €3.0m, whilst the best ever gain was €3.2m. So let’s say the biggest moves we’ve ever seen are between +/- 32 basis points on the spread.
The Rates CCP is offering a diversification benefit for trading these two swaps together. If I traded NOK at Eurex and SEK at LCH, then my Initial Margin requirement would be double, compared to clearing all of it at LCH (or all of it at Eurex).
What if this diversification benefit is inaccurate in the future? What if we should treat NOK moves and SEK moves as independent events? Based on worst case for NOK and worst case for SEK, that would mean moves on the spread of -66bp/+79bp.
For our €100k position, that means our Initial Margin would still only be €5m short of covering the moves! We are a long way from finding a €100m hole here…!
NOK vs SEK in huge size
It is important to note that liquidity add-ons in one currency do not cancel out liquidity add-ons in another currency as part of the diversification benefit.
- A position of NOK22bn vs SEK23bn (roughly €2m in DV01) should have an IM requirement of €44m if it scaled in a linear manner.
- But due to the add-ons, this increases to EUR83.2m!
However, what we could imagine happening is a complete breakdown of the historic relationship of these two products. So instead of moving together, a stress event might mean that SEK rates move UP and NOK rates move DOWN. So let’s see what the Initial Margin shortfall could be in this scenario:
- If the spread blew out by 79 basis points (the combination of the two worst independent moves), we might have an Initial Margin shortfall of €74m (the risk of €2m DV01 would result in a loss of €157m whilst the IM held is €83m).
Why we should NOT be worried by this €74m
This is a hypothetical scenario.
It is in very large size.
It would be a complete breakdown in historic moves.
We have multiplied a five-day move (of 30 basis points) and assumed that a much larger move could happen within the space of a single day (79 basis points).
We are assuming that a spread could move by 2.5 times it’s historic worst case scenario.
We are ignoring the fact that IM is called and calculated DAILY.
We are ignoring all of the risk controls that would kick-in following such a break-down.
And we ignore all other positions.
In light of which, I’m comfortable that the combination of diversification benefits and penal liquidity add-ons act as sufficient ways to mitigate the risk of bizarre margin offsets that might have occurred during historic periods.
I am also thankful to CHARM for helping me come to these conclusions – I can sleep better tonight as a result!
Great analysis. Thank you.
NOK and SEK? Really? Is that where the risk in the CCPs is?
A one day move is unlikely to need the default fund if your position is 100k in NOK… well knock me down with a feather.
The default fund is not at risk from a small player in a marginal currency going bust, it is there to cover the eventuality of a large member going bust, surely you know that?
Thanks for the comment Bob. The idea of the piece was to draw a parallel with the Nasdaq default – where a position in a small, relatively illiquid spread market lead to use of the default fund. I was looking at the likelihood of a large position *in a spread* between two less liquid Rates markets having similar effects. Apologies if that wasn’t clear in the article.
Why don’t you perform the same analysis on Nasdaq before the default, and see the likelihood of needing the default fund beforehand? Then compare it to the actual realization.
What does that tell you about the utility of looking at historical moves?
If you had applied this reasoning ” We are assuming that a spread could move by 2.5 times it’s historic worst case scenario” how would your risk model have turned out?
Hi Bob;
Thanks for the comment, that’s exactly the kind of thing we would do if this had really happened in Rates markets. However, we don’t currently have the Nasdaq IM model in our software, so this would be a large lift just for a thought experiment! Maybe in the future….