Continuing with our monthly review series, let’s take a look at Interest Rate Swap volumes in July 2015.
First the highlights:
- On SEF USD IRS July 2015 volumes were lower than June, but higher than April and May
- SpreadOvers had their best month since January
- Butterfly volume is up in both June and July
- USD Swap Curve flattened with 30Y down -19bps
- SEF Market Share in July remains the same as YTD
- The Large D2C flows seen in June did not occur in July
- On SEF Compression volumes were healthy, with TW dominating
- CME-LCH Basis Swap Volumes are running at $35 billion per month
- On SEF vs Off SEF in USD IRS hit a high of 65% vs 35%
- LCH SwapClear had a YTD high in July
- LCH SwapClear Client USD IRS was 63% vs 37% at CME, a YTD high
And there is more.
So onto the charts, data and details
USD IRS ON SEF
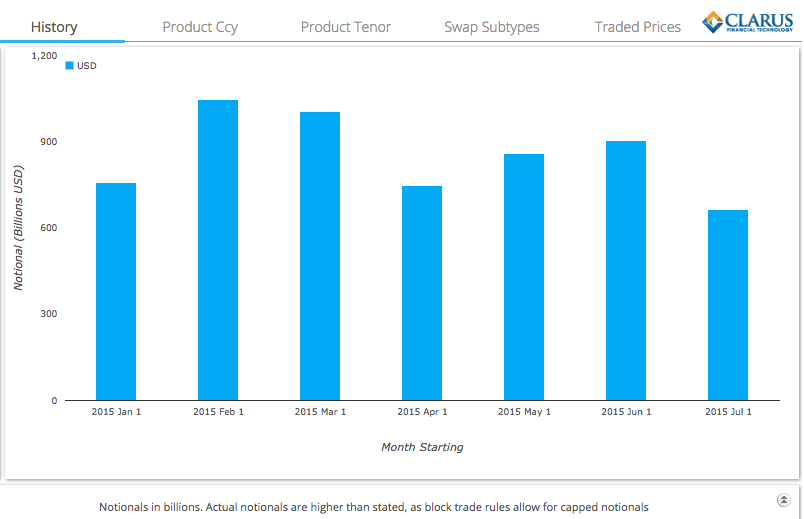
Using SDRView lets start by looking at gross-notional volume of On SEF USD IRS Fixed vs Float and only trades that are price forming, so Outrights, SpreadOvers, Curve and Butterflys.
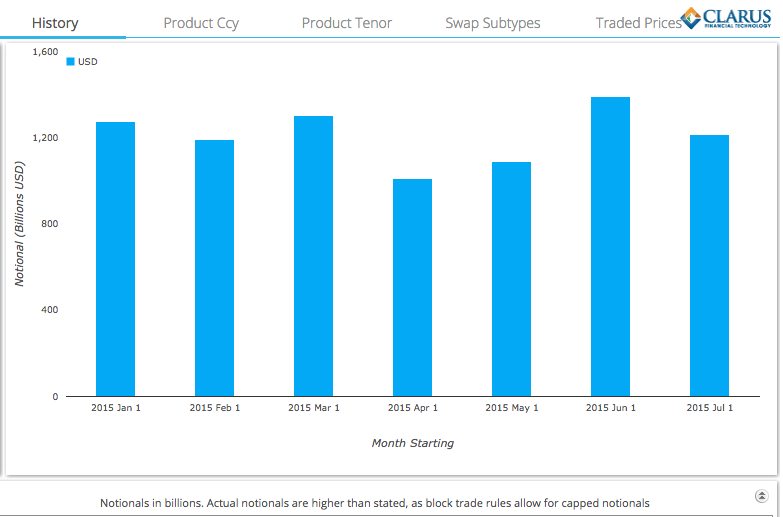
Showing that:
- July gross notional was >$1.2 trillion
- Down from the June gross notional of > $1.4 trillion
- June was the highest volume month in 2015
- July was higher than April and May, but lower than March
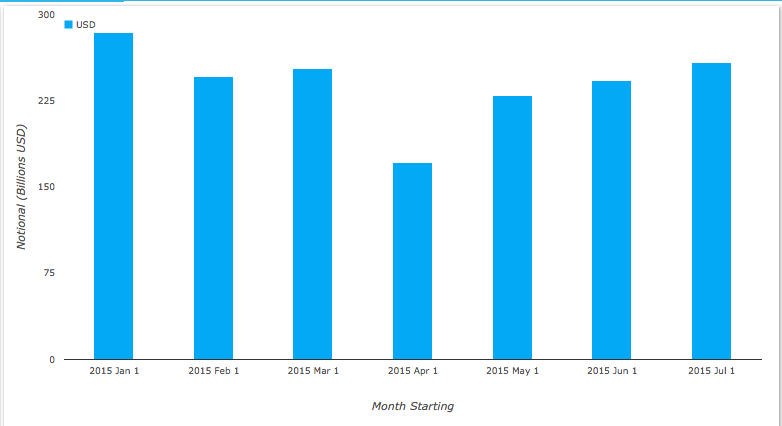
Isolating just SpreadOver volumes, we see that in-fact July was higher than June and every month except January.
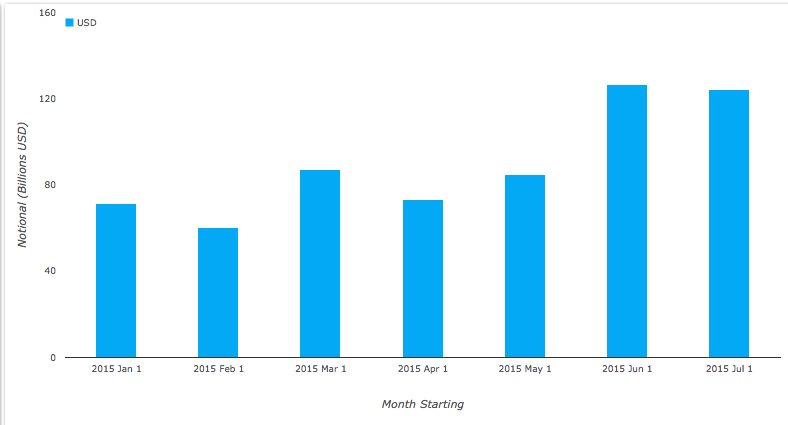
Isolating Butterfly volumes, shows June and July with much higher volumes than prior months (note these figures aggregate each leg of the butterfly package).
USD IRS Prices
Using SDRFix lets take a look at what happened to USD Swap prices.
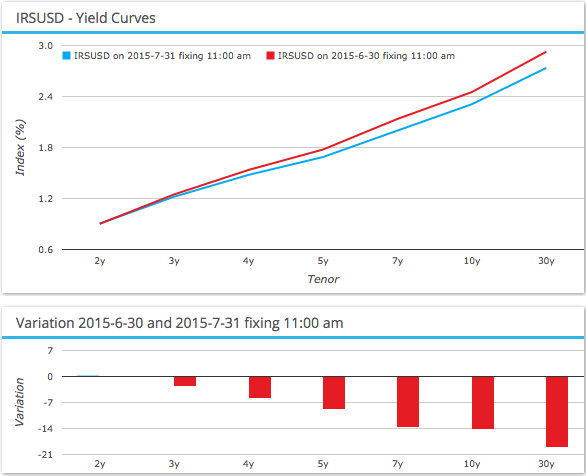
Showing that the Swap Curve:
- Flattened over the month
- With 2Y flat, 5Y -9bps, 10Y -14bps and 30Y -19bps
- Almost a mirror of the Steepening we saw in April
- A good month for Curve and ButterFly trades in the right direction
EUR, GBP, JPY Swaps
Lets also take a look at On SEF volumes in the other three major currencys.
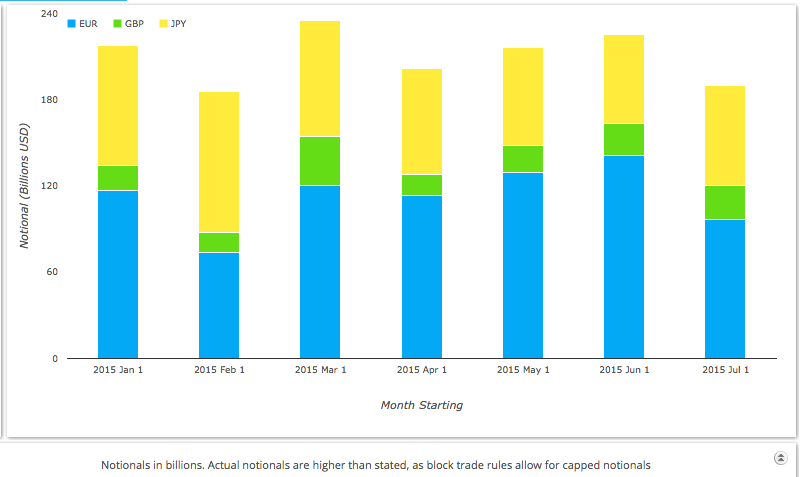
Showing aggregate July volumes lower than any month except February.
On SEF Compression Activity
SEF Compression activity for USD IRS shows healthy volumes at >$176 billion, with only June and March higher, while EUR has meaningful volume each month.
SEF Market Share
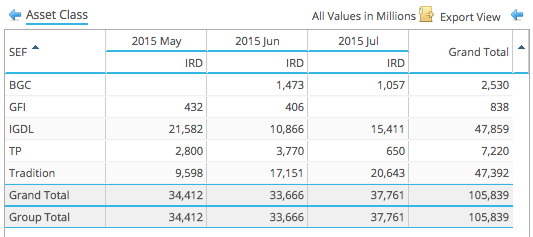
Lets now turn to SEFView and SEF Market Share in IRS including Vanilla, Basis and OIS Swaps.
As in previous months we will start by looking at DV01 (in USD millions) by month for USD, EUR, GBP by each SEF.
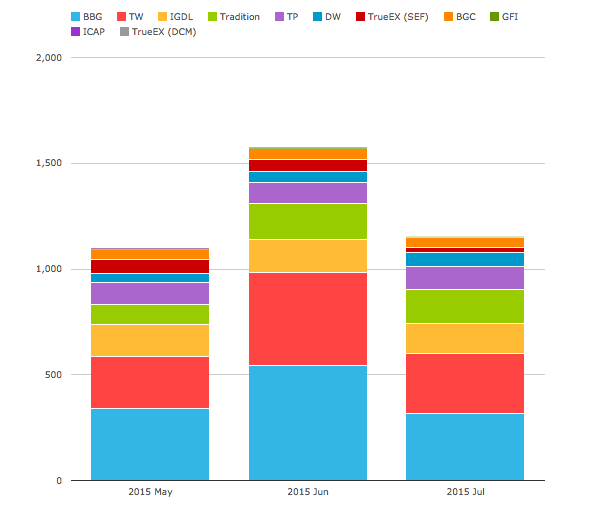
Showing that:
- Overall July volume is down from June and similar to May
- BBG and TW are down from June and similar to May
- So the large D2C flows that Chris highlighted in June, did not happen in July
- D2C share is back to April’s 53% of overall (including Compression)
- D2D volumes were similar in July to June and higher than May
- D2D share is back to April’s 47% of overall (including Compression)
Next DV01 volumes with Compression volumes stripped out as per our previous assumptions.
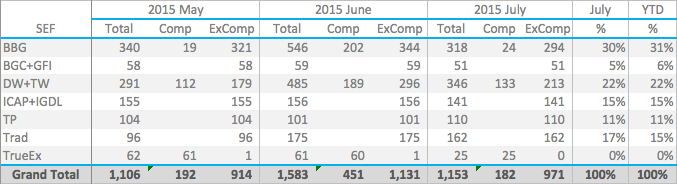
Showing that:
- Market Share in July reverted to the YTD averages for most SEFs
- Only Tradition has a higher share in July than YTD, perhaps reflecting higher Butterfly volumes in the month
- BBG and BGC+GFI, each have 1% less share in July than YTD
- D2C SEF volumes (BBG, TW) are down from June
- BBG remains the largest with 30% share, followed by DW+TW with 22%
- D2D SEF volumes are broadly similar
- ICAP and Tradition are neck and neck
- Followed by TP and then BGC+GFI
- Compression activity at TrueEx is half that in the previous two months
- Compression on BBG is back down to May figures
- Compression on TW (estimated) is down from the June high but above other months in 2015
CME-LCH Basis Volumes
Using the new DCO filter in SEFView we can get an insight into CME-LCH Basis volumes.
Showing that:
- An average of $35 billion (single-sided) gross notional has traded in each of the last 3 months
- ICAP and Tradition are neck and neck with $47 billion each
- It will be interesting to see how volumes develop August
(Our assumption here is that all CME Cleared Swap executed by the D2D SEFs are one leg of a CME-LCH Basis Swap).
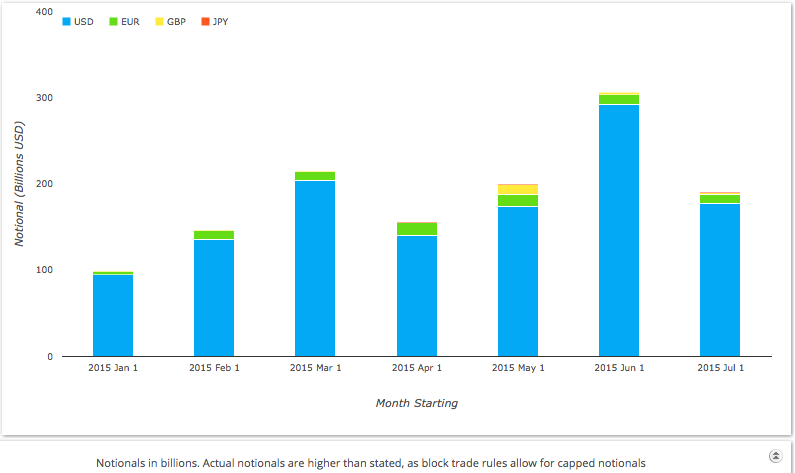
OFF SEF USD IRS
Changing topic, it is worth checking how Off SEF volumes have done in USD IRS.
Showing that July had the lowest volume of any month YTD.
Looking at an On SEF vs Off SEF split for each of the major currencies.
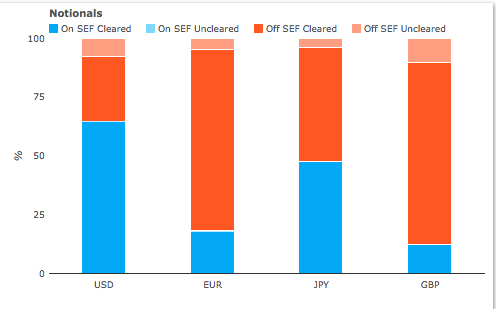
Shows that:
- USD IRS On SEF hit a high of 65% in July
- USD IRS Off SEF Cleared was 28% and UnCleared was 7%
- EUR & GBP On SEF percentages remain low at <20%
- JPY On SEF percentage was 48%
Global Cleared Volumes
Finally lets use CCPView to look at Global Cleared Swap Volumes for EUR, GBP, JPY & USD Swaps.
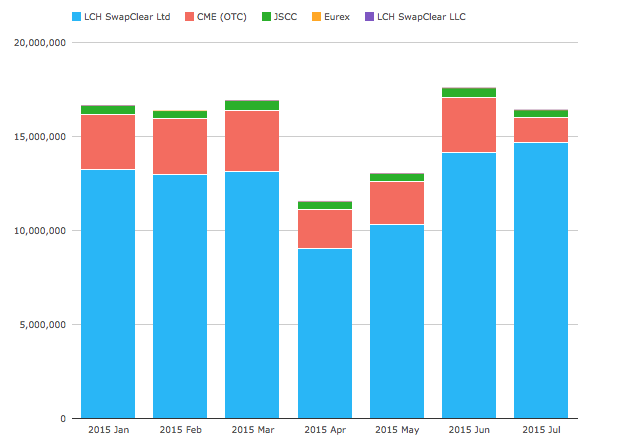
Showing that:
- LCH SwapClear Ltd gaining volume with a YTD high of $14.6 trillion in July
- CME OTC losing volume with a YTD low of $1.3 trillion in July
- JSCC volume at the lower end of its $410-$550 billion range with $424 billion in July
- Eurex with a small uptick to $7 billion in July from the $3 billion level in April
- LCH SwapClear LLC with a small uptick to $6 billion in July from $3 billion in June
And focusing just on USD Vanilla IRS and Client Clearing:
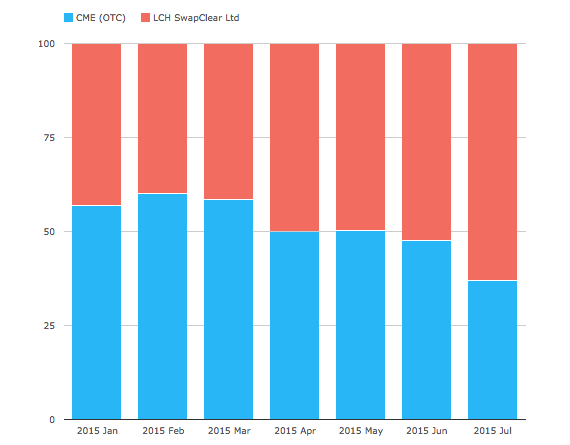
We see CME at a YTD monthly low of 37% vs LCH SwapClear at 63%. A significant swing from the Jan 2015 57% vs 43% and a further strengthening of a trend we have covered before, see LCH makes gains.
Thats it for today.
A lot of charts.
Thanks for persevering to the end.
Thanks for preserving to the end.
Should be
Thanks for persevering to the end.