Now that November data is in, I wanted to update my blog October Volumes in Interest Rate Swaps.
USD IRS ON SEF
Lets start with a chart from SDRView Res showing USD IRS On SEF volumes:
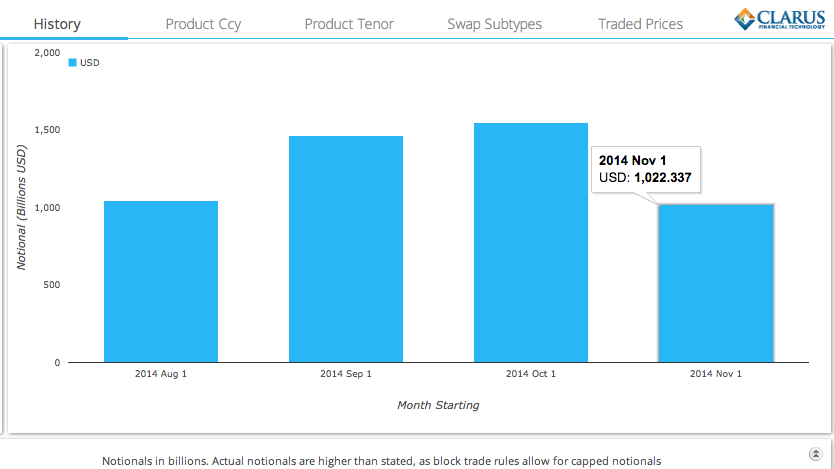
A disappointing month after the record volumes seen in September and October; with volumes similar to August.
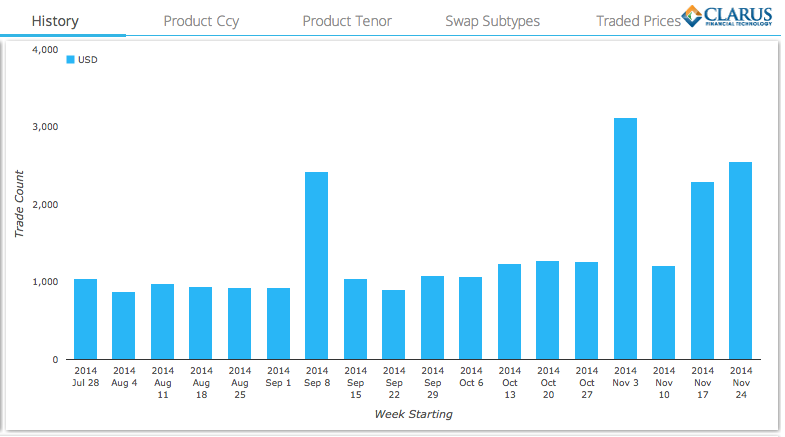
And the same data but by week:
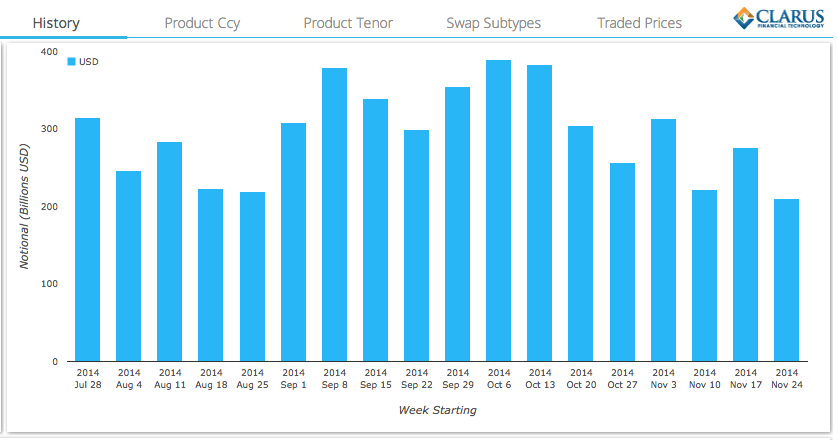
Shows that while the week of Nov 3 was reasonable, the week of Nov 10 and Nov 24 (Thanksgiving) were the lowest in the past 3 months.
And just for completeness sake, the same period but showing DV01:
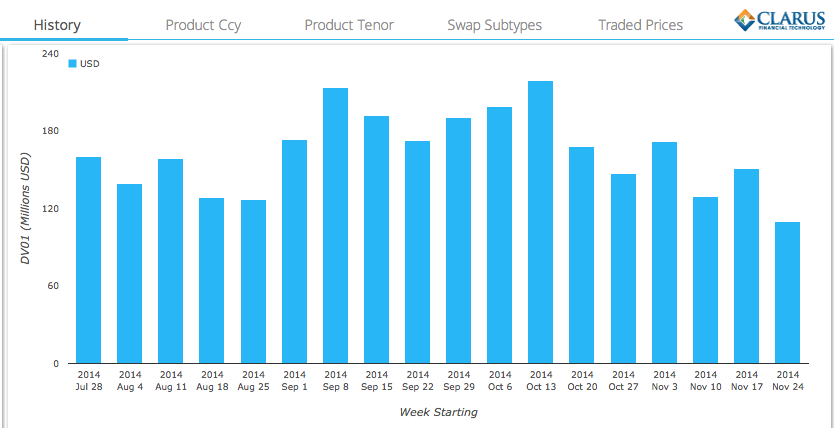
Which more clearly shows the low in the Thanksgiving week and that Oct 13 was the highest volume week and not Oct 6 based on the risk transacted; which is as we would expect given the large market moves seen on Oct 14 and Oct 15.
USD IRS OFF SEF VOLUMES
Lets now look at Off SEF USD Swaps for the same period.
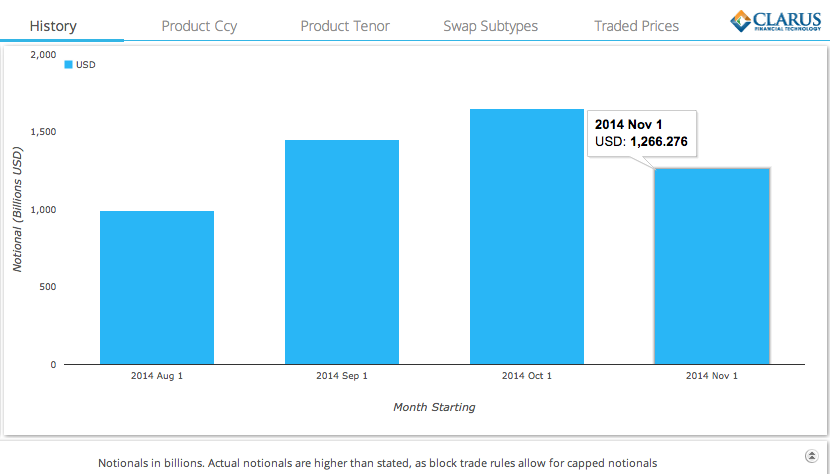
Again lower than Sep and Oct, but much higher than Aug. Also higher than On SEF volumes by more than $240 billion.
Lets compare On SEF and Off SEF for November, this time in DV01 terms.
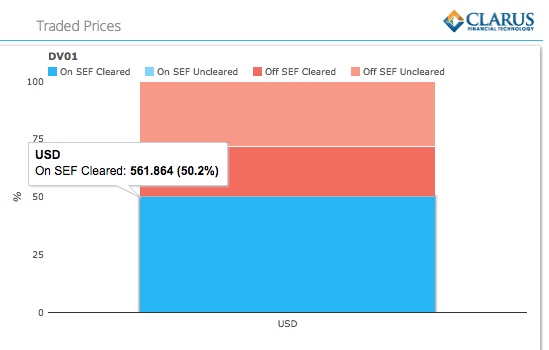
Which shows On SEF Cleared is 50% of the DV01 volume, down from the 58% we saw in October.
Not what we would expect. So what is going on?
Well the large Off SEF Uncleared is the clue as it is much larger than the comparative in October.
Lets look at Off SEF Uncleared trade volumes by week:
We see very unusual spikes in the weeks of Sep 8, Nov 3, Nov 17 and Nov 24. Trade counts in these weeks are much higher than the average of around 1,000; as high as 3 times the average.
This are the same spikes I reported in EUR IRSwaps: Huge Spikes in Volumes. While I have received a few suggestions on what could be the cause of these, none have been utterly convincing. About the best is that a previously exempt (from clearing and US reporting) participant is now no-longer exempt from US reporting and hence these trades.
Anyone able to confirm this or provide a better reason, please add a comment below.
Excluding these spikes we would see that the On SEF% would be similar to the October percentage of 58%.
What Did the Market Do?
We have seen the low volumes, what about Swap prices?
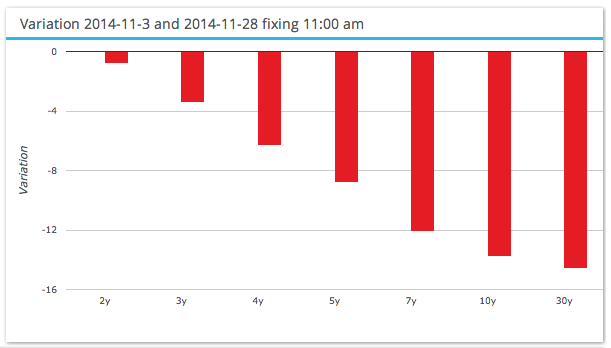
Which show a flattening of the Swap Curve with the long end down 14.5 bps over the month.
So far quieter than October, but still a clear trend over the month. One which would have been very profitable for those who put on Flattener Curve Spreads: 2Y5Y, 5Y7Y, 5Y10Y.
SEF MARKET SHARE
Using SEFView for November Volumes in the Major Currencies for IRS, OIS Swaps, Inflation Swaps and FRAs, in 5Y Swap Equivalents.
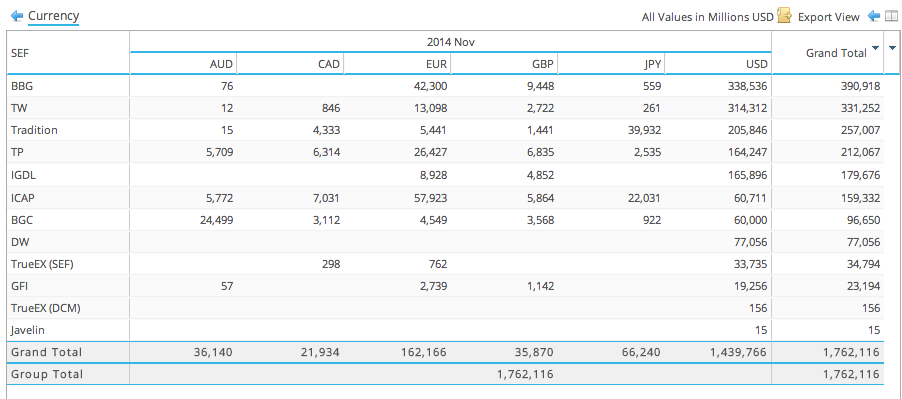
A wealth of data, lets try and summarise:
- AUD is the 4th highest volume.
- AUD – BGC has 67%, then ICAP and Tullets with 16% each.
- CAD is the 6th highest.
- CAD – ICAP has 32%, then Tullets 29%, Tradition 20% and BGC 14%.
- EUR is the 2nd highest with 9% of the total.
- EUR- ICAP/IGDL has 41%, then BBG 26%, Tullets 16% and TW 8%.
- GBP is 5th highest.
- GBP – ICAP/IGDL has 30%, then BBG 26%, Tullets 19%, BGC 10% and TW 8%.
- JPY is 3rd highest.
- JPY – Tradition has 60%, then ICAP 33% and Tullets 4%.
- USD is by far the highest volume, 82% of the total.
- USD – DW/TW has 27%, then BBG 24%, ICAP/IGDL 16%, Tradition 14%, Tullets 11% and BGC 4%.
Overall, we see that DW/TW with 23% and BBG with 22% are leading neck and neck, as they were in October.
We know that TW has significant volumes in List/Compaction trading, usually between 20-30% of the total. BBG has also recently launched List/Compaction trading and breaks out these in its reported figures, so will be interesting to see the comparison with TW and TrueEx. (See Chris’s blog of this week).
BBG also has a strong showing in EUR and GBP, much more than TW, while DW has no volume outside USD.
ICAP/IGDL is next with 19% and a very strong showing in CAD, EUR, JPY and AUD.
Tradition is next with 16% and a very strong showing in JPY and CAD.
Tullets is next with 12% and a strong showing in CAD, EUR, AUD.
BGC is next with 5.5% and a very strong showing in AUD and strong in CAD and GBP.
TrueEx has 2% as compaction/compression volumes continue to go well in USD ($33b) and some activity in EUR and CAD., while the TrueEx DCM only shows 4 days of trading activity for a cumulative $156m.
GFI has 1% with $19b in USD.
Javelin shows just $15m, from a $25m 3Y Swap on 4 Nov.
SEF Weekly Volumes
As the first week of December is also in, lets look at the SEF figures by week, just for USD and see whether activity has picked up.
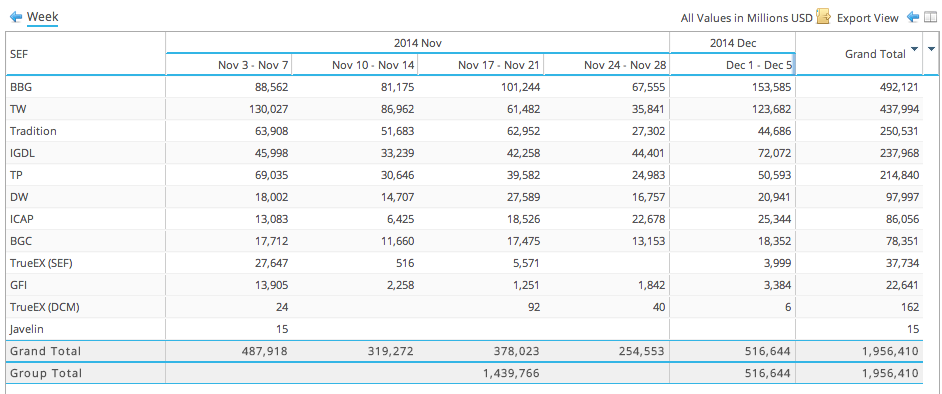
Indeed it has with over $516 billion traded last week, double the amount of Thanksgiving week and higher than any week in November.
We also see the variability of numbers posted by each SEF week to week:
- TW Nov 3-7 shows $130 billion (presumably driven by Compaction List trading)
- BBG Dec 1-5 shows $153 billion
Summary
November was a low volume month, with volumes similar to August and far lower than September and October.
Weekly volumes show that Nov 10-14 and Nov 24-28 (Thanksgiving) were very low volume weeks.
Off SEF Volumes were higher than On SEF, largely due to large Uncleared Off SEF trades reported on Nov 3, Nov 17 and Nov 24. Excluding these meant the On SEF percentage of total was similar to the 58% seen in October.
The Swap Curve flattened over the month with the long end down -14.5 bps and the short end down -0.5bps, generating good profits for Flattener Curve Spread trades.
SEF Market Share in the six major currencies is interesting.
TW/DW and BBG continue their dominance in USD, which represents 82% of total volume in these currencies. Both have good Compaction/List Trading volumes and BBG also shows good share in EUR & GBP.
ICAP/IDGL follows in USD and has a very strong showing in CAD, EUR, GBP.
Tradition is next and has a large share of JPY.
Tullets is next with 12% and a strong showing in CAD, EUR, AUD.
The rest are all below 5%.
December volumes look to be much higher, with the first week being higher than any in November.
It will be interesting to see how the year ends.