Recent weeks and months have seen record volumes traded On SEFs, so I wanted to update my July Blog; A Six Month Review of Swap Volumes.
USD IRS On SEF Volumes
Lets start with On SEF USD IRS plain vanilla volumes by month in SDRView Res.
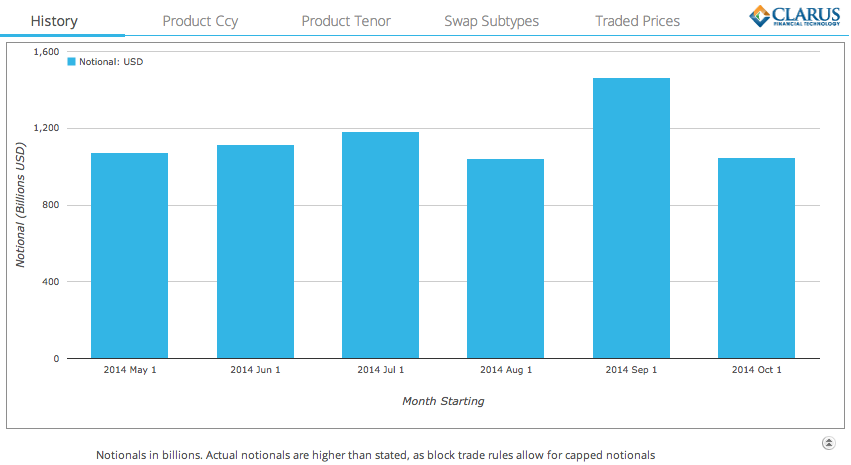
Which shows that:
- September was a record month with more than $1.46 trillion traded
- In-fact as this volume is capped, from SEFView we know the actual un-capped volume was $1.59 trillion
- As September is an IMM month, some of this volume is due to future rolls
- However the same argument can be made for June
- So in all likelihood this is not a large component of the increase
- October with only 13 out of 22 days reported, is already at $1.05 trillion
- So October is on track to exceed September volumes
Swaps Compression
A factor to consider in the volumes is the level of Swaps Compression activity. If you read my blog on Swaps Compression, you will know that trueEX and Tradeweb are the two SEFs that perform the bulk of this SEF activity.
Lets use SEFView to look just at the volumes reported by these.
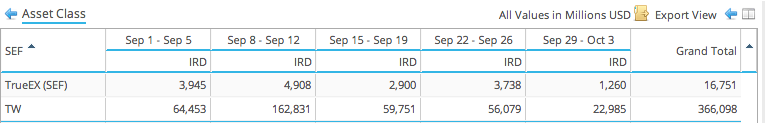
We know that all the trueEX (SEF) volume is compression, so this figure is $16.75 billion in September.
Tradeweb public reporting unfortunately does not breakout compression from their overall volumes. Anecdotally we know that compression represents between 20% and 30% of their overall volume. So assuming 25%, we get $91 billion.
As we are not aware of other SEF compression activity in September, this gives a grand total of $108 billion or $0.1 trillion.
A small fraction of the $1.59 trillion September volume.
Some folks believe that compression activity should be excluded from trading volumes. However as this activity requires new trades to be executed that offset existing trades and as such a transfer of risk between two parties takes place, I believe they should be included in trade activity volumes. And even if we were to exclude, it does not make a material difference to volume trends.
Very recently we have seen Bloomberg start to offer compression on its SEF and the reported data for 20 October shows the first such trades in SEFView.
![]()
USD IRS Off SEF Volumes
Lets now look at the Off SEF volumes for the same period.
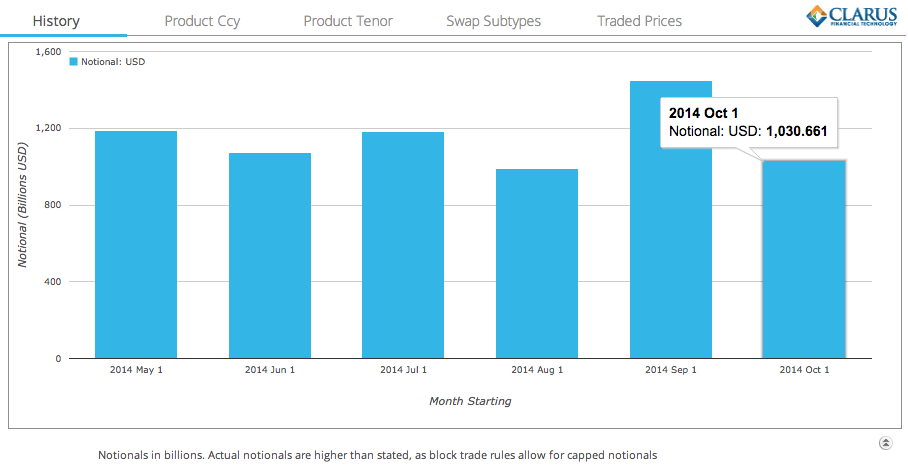
Which shows exactly the same trend as On SEF and comparable record volumes in September and October.
Comparing On SEF and Off SEF for October data.
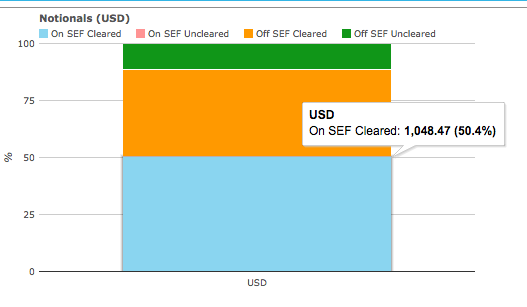
We see that:
- On SEF Cleared is 50.4%
- On SEF Uncleared is 0.1%
- Off SEF Cleared is 38%
- Off SEF Uncleared is 11.5%
And breaking these down further, just for the week of Oct 13-17.
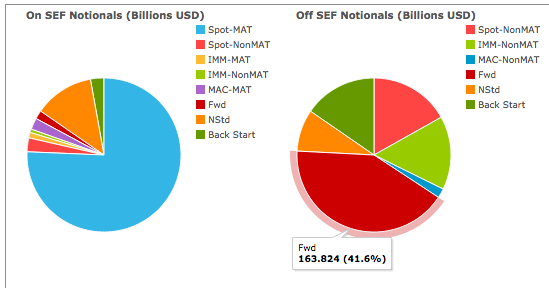
We see that:
- Spot-MAT represent 75.7% of the On SEF Volume
- Forwards represent 41.6% of the Off SEF volume
- Non MAT Spot tenors (e.g. 1Y, 8Y, ..) represent 16.9%
- Non MAT IMM represent 15.4%
Swap Prices
A reason given in the press for higher volumes is the return of market volatility.
Using SDRFix we can determine the change in prices that has taken place in October.
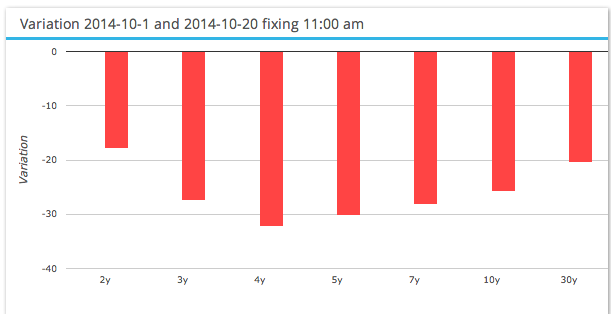
Which shows massive moves of down 30 basis points across much of the curve.
Plotting daily 11am EST prices from 1 May to 20 October 2014.
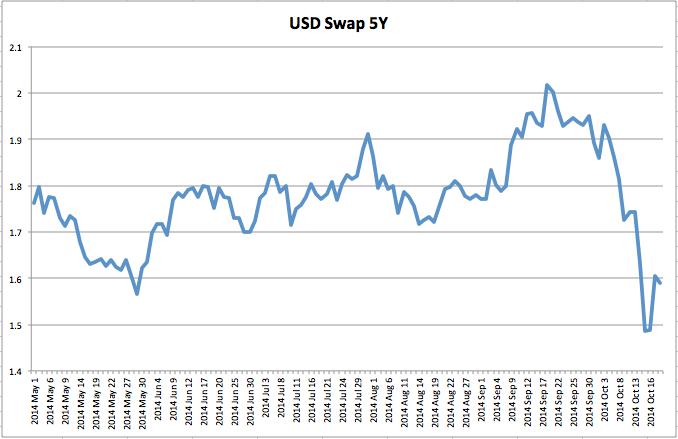
We can see that after trading in the range 1.7 and 1.8 in June and July, there was a spike to 1.9 on July 31, back down into the 1.7 to 1.8 range and then from 9 Sep onwards a large increase in prices and from 1 Oct a large fall.
So clearly much higher price volatility in September and October than earlier months.
Volatility begets volumes and volumes in turn drives volatility.
SEF Market Share
And what of SEF market share in USD IRS Fixed vs Float?
Lets use SEFView to show the share in 5Y Swap Equivalent for the months of Sep and October to date.
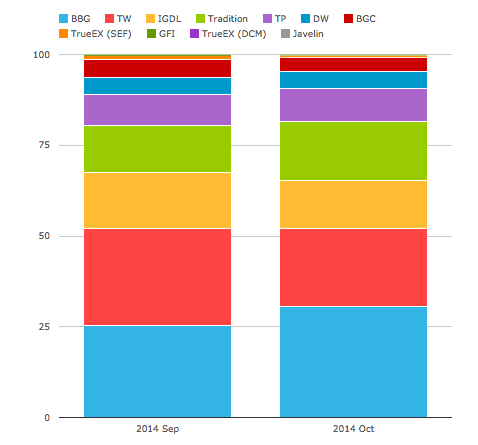
Which shows that:
- Bloomberg is the leader with 25% in Sep and 30% in Oct to date.
- Tradeweb follows with 27% in Sep and 22% in Oct.
- IGDL next with 15% and 13%
- Tradition 13% and 16%
- Tullets 8.5% and 9%
- Dealerweb 4.8% and 4.8%
- BGC with 4.9% and 3.9%
So not too different to the chart I produced in June, see the last chart in the Six Month Review blog here.
Only changes of note are that Tradition’s share is up 3% and Tullets down 4%.
Summary
September was a record month for USD IRS volumes both On SEF and Off SEF.
$1.6 trillion of USD Swaps were traded in September.
October is on track to have even higher volumes.
Compression activity represented $108 billion or 6% of total volume in September.
Off SEF Cleared Volumes were 38% of the total in October to date.
Forwards were the bulk (42%) of these, followed by Non-MAT Spot tenors and Non-MAT IMM.
Market volatility hit a high for the year with Swap prices dropping 30 basis points in the first 3 weeks of October.
SEF Market Share was similar to June, with Bloomberg leading and Tradeweb next.
Slight change in IDBs with IGDL flat, Tradition up, Tullets down.
It will be interesting to see how the remainder of October play outs.
And whether the higher volatility and higher volumes continue into November and December.
We live in uncertain times.