In yesterday’s article, SEF MAT Feb17, What Does the SDR Data Show, I promised a follow-up today.
Assuming you have read that piece and if not I recommend you do so first, here is the follow up.
USD Interest Rate Swaps on Feb 18
As the first US trading day after Make Available to Trade (MAT) for USD IRS, lets start with a chart.
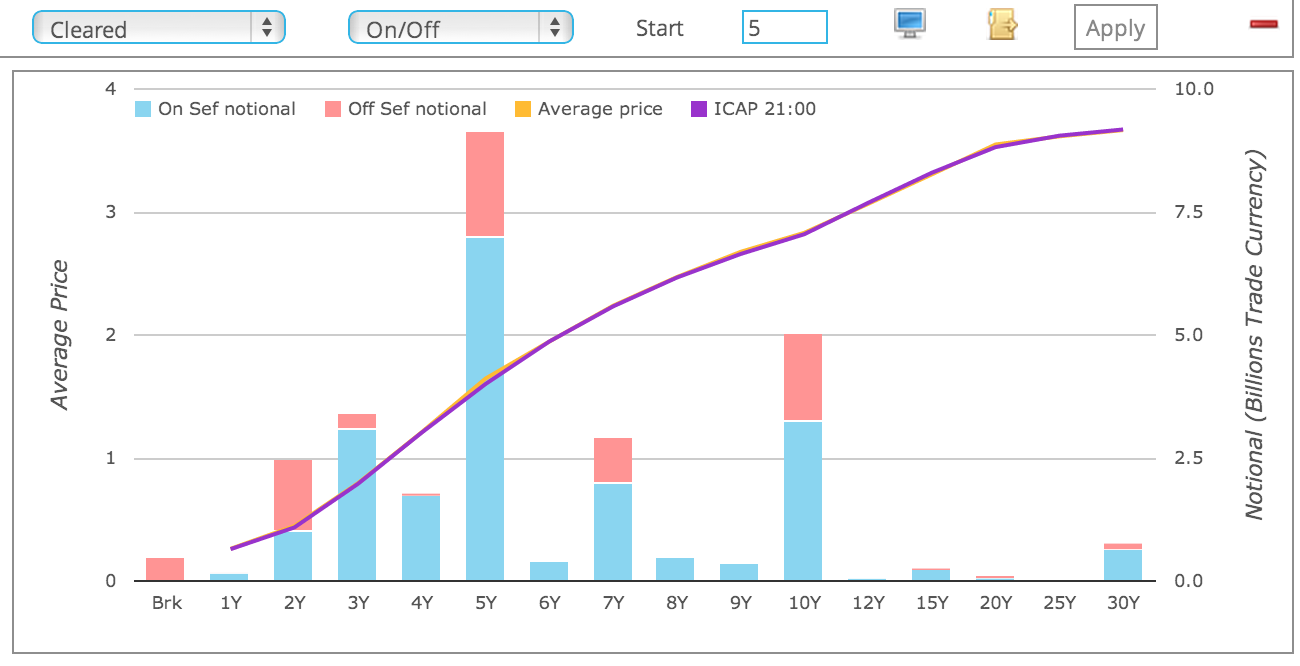
Which after my exuberant comment at 9:15am EST yesterday (blue as far as the eye can see), is a little disappointing.
More Off SEF (red) than I would have expected.
Lets dig a little deeper with a table.
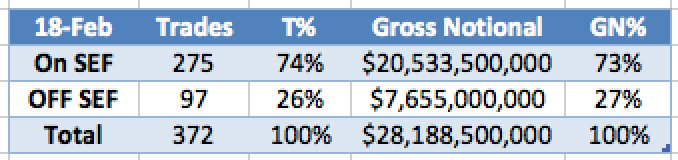
From we can observe that for Cleared USD IRS (spot starting):
- The total reported volume was $28 billion
- A lower than usual volume day
- e.g. last week daily vols were, $32b, $45b, $61b, $49b, $43b
- And the prior business day after a public holiday, Jan 21 had $44b
- So a subdued first day of trading
- More interestingly the On SEF Volume was 73% and Off SEF 27%
- Which is surprisingly high for Off SEF (remember we are excluding all the forward start trades here).
USD IRS Off SEF
Lets look at a table by tenor for the Off SEF Swaps.
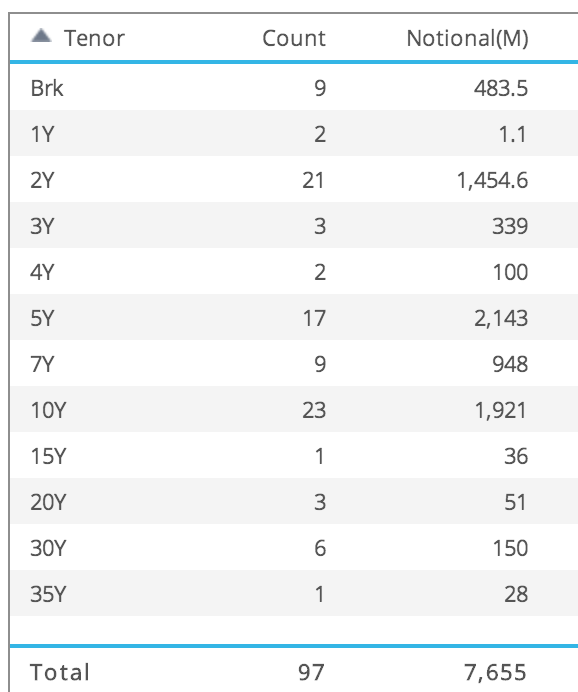
From which we can observe:
- Broken date tenors (not whole years) are not MAT
- So we see 9 trades of $483m gross notional
- 1Y is not MAT and has 2 trades of $1.1billion
- 4Y is not MAT and has 2 trades of $100million
- 35Y is not MAT and has 1 trade of $28 million
- All the remaining tenors are MAT
- So 83 trades of $7 billion are Off SEF for MAT tenors
We know that non-Par swaps are not MAT and Packages are exempt till May-15.
And indeed drilling down into these trades we do see that they are either Non-Par Swaps (so the fixed rate is away from par) or we can assume that they are Packages (the DTCC SDR public feed has no way to categorically confirm one way or the other).
However $7 billion out of $28 billion, is 25% and represents a big chunk.
All Types of USD IRS
The picture looks even worse, when we look at All Cleared USD IRS Swaps of type Fixed vs Float.
So Forward, IMM, MAC, Non Standard, etc.
Lets look a table of what is available in SDRView Researcher as reported to the DTCC US SDR.
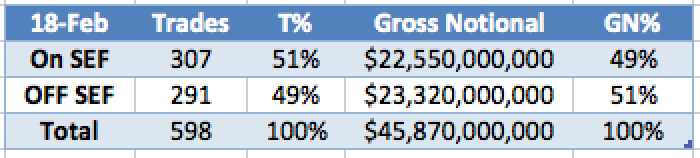
From which we observe:
- The total volume is $45.87 billion as opposed to the $28 billion we saw earlier
- So $18 billion of Swaps are being excluded
- Which means that we are down to 50% of Swaps being On SEF
- Whether we look at trades or gross notional
Opinion
The MAT submissions for IRS from Javelin are a good start and the TrueEx (Feb 21) and TradeWeb (Feb 27), will extend the coverage.
We think this will still leave a large chunk of the market non-MAT and Off SEF.
The Packages exemption not being extended beyond May 15, will be a big help.
However we believe that the whole curve should be MAT.
So broken dates, non-par swaps, any fwd tenor or convention; as these can all be priced and hedged off a liquid curve of on-the run Swaps, with the appropriate basis spread applied.
And an RFQ model, which is electronic can easily support such pricing.
A CLOB model, probably not, as the number of combinations would be prohibitive.
Could this be a reason for those firms keen to retain RFQ to push for all IRS to be ON SEF?
Equally for those firms keen on CLOB, to push keep it to a few standard tenors?
It will be interesting to see which prevails.
Or whether they can both co-exist for segments of the market.
Summary
Feb 18, was Day 2 of SEF MAT and the first day of USD IRS trading.
73% of Cleared USD IRS (spot starting) were On SEF.
27% were not, either as Non-MAT tenors, non-par price or package.
If we look at all Cleared USD IRS (not just spot starting), we see that 50% is On SEF.
So a good start, but a lot of work to do.
We live in interesting times.
As usual I invite you to try SDRView and track market changes as they happen.
Interesting stats, but not very clear from what I can read. It would be helpful to detail the total population of trades, those that were cleared, those that were MAT, and those that were traded on a SEF. Otherwise it is difficult to understand the different categories of trades. Basically there are several categories of trades, but hard to see from the above what is what. Thanks.