 Week 8 is in the books. For this week, I set out to enhance the SEF reporting to be more similar to the Clarus SDR reporting. That is, I was hoping to be able to readily slice and dice the SEF data so I could look at the results by SEF, currency, asset class, product type, currency pair, etc, etc.
The data we have been collecting has been stored since the launch of SEF reporting on October 2. Up until this week, the level of aggregation we have done has been simply on SEF, date, and asset class (IRD, CRD, and FXD). The data itself was only enriched and interpreted in order to arrive at a USD equivalent notional.
However to do some of the slicing and dicing I wanted to do, I set out to enrich and normalize the data for not just asset class, but also ccy, ccypair, product type, and tenor.
I picked a good week for it. Chinese numerology states that the number 8 lends itself to success and prosperity. So, did I succeed?
THIS WEEKS NUMBERS
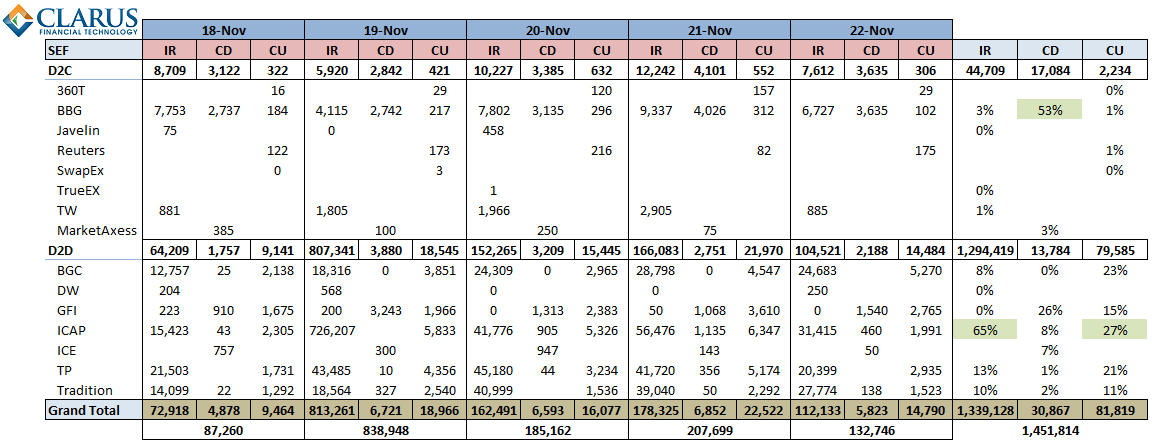
We’ll start with the standard table I have been publishing since week 1. This shows daily SEF volumes, quoted in millions of USD Equivalent, across all currencies, broken down by asset class. With the enhanced data, we also have a new reporting format, which I am happy to take comments on. I’ve chosen to group by D2C and D2D. Note that this week we are using the SEF terms for asset class (IR, CD, and CU) instead of what I had been using to date (IRD, CRD, FXD, respectively).
JUST FLICK THE SWITCH
One of the benefits of the new reporting framework, is I can now just choose to exclude IR FRA’s, and I immediately get the table we have been looking at over the more recent weeks, which excludes the large FRA activity:
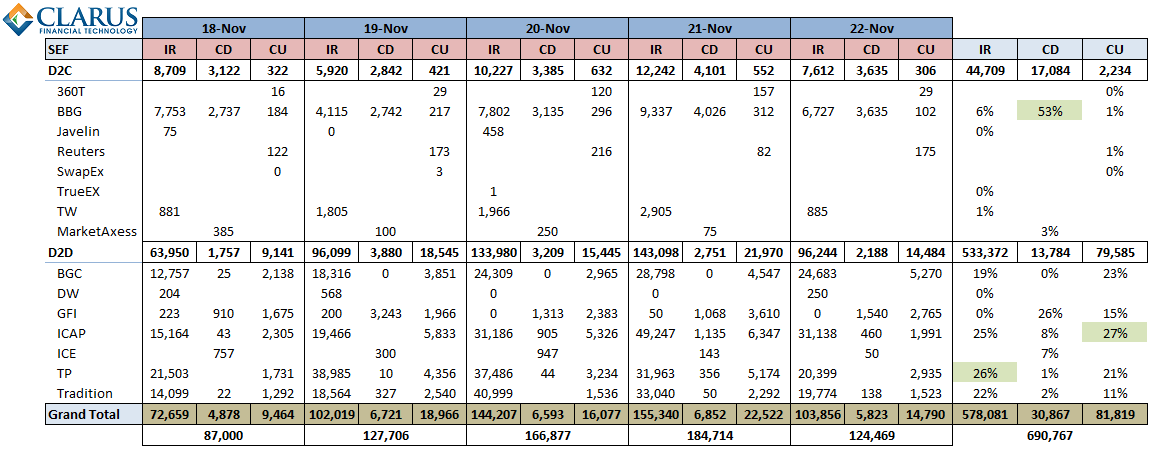
NEW REPORT, SAME STORY
So, we can change the reporting framework, but we cannot change the story. The rates space remains the same battle, however with a decent showing by Tradition this week for a solid third place. Credit and FX are the usual broken record.
The week-on-week changes are always interesting to look at, in the below table (yes the new reporting framework is not doing this for me yet):
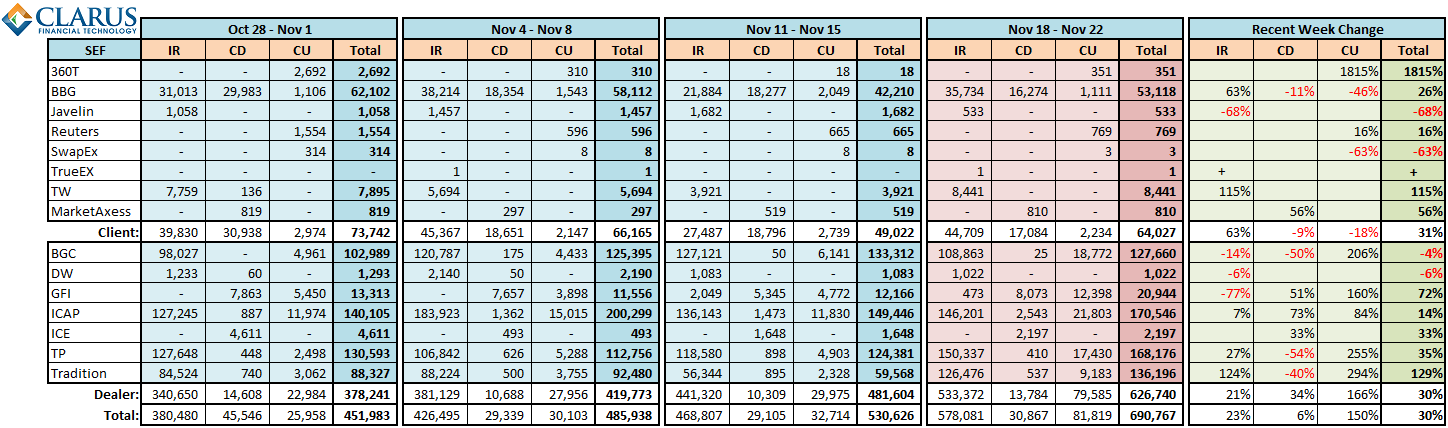
Some observations:
1) The large jump in 360T FX activity may be due to a change in their reporting. I need to confirm with them, but recently I was told that the notional amounts they reported followed no rhyme or reason for being in currency 1 or currency 2 terms. While the percentage change is a large jump, the results are not very significant in real terms.
2) The drop in BBG FX appears to just be reverting to their previous mean.
3) Tradewebs numbers make me think there has been some additional clients onboarded there.
4) GFI’s large percentage drop in rates appears to be simply a reversion back to previous weeks’ status quo. And good to see an offsetting leap on the FX business for a record week.
5) FX activity across all IDB’s were significant. The new enhanced reporting tool is able to give the breakdown here by product type (NDF, FX Option) and currency pair!
6) The approximately 30% increases may be due in part to the US holiday on Monday Nov 11; so we would expect to see some increase to account for this.
NEW TOY
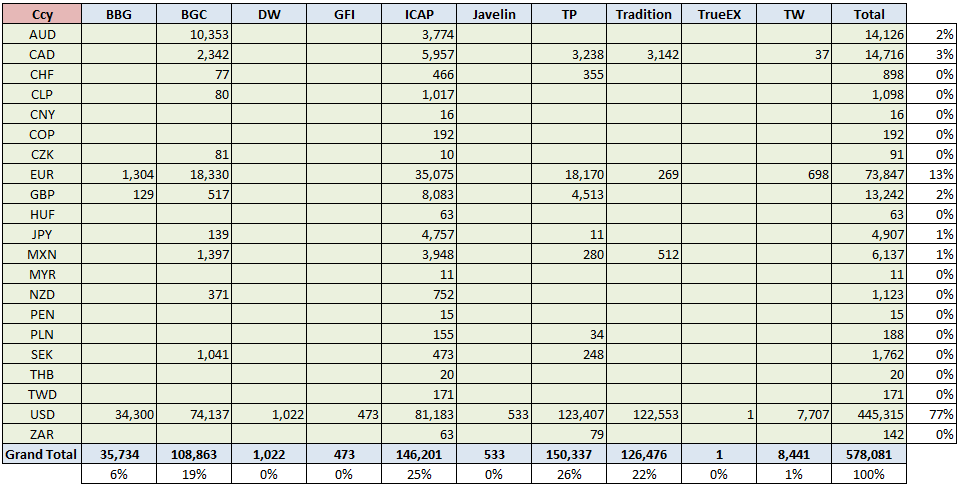
So now that we have all of this data, we can get some interesting reports out. I chose to look at the IR activity (ex-FRA) by currency by SEF. The results were in line with what the SDR data is showing me, namely that 3/4 of the activity is in USD, and half of the remaining activity is in EUR.
WANT MORE?
As the data enrichment of the SEF data improves, there are great possibilities to mine this data in new and useful ways. If you have particular needs and interest for this data, please get in touch with us, we’d love to hear from you.
UPDATE
This weekly issue of SEF updates is not the most current. To see all SEF posts, including the most recent, please click through to the SEF Category.
Tod
I really like the reports you started to provide on the site. It gives the reader very useful overview of what is going on in this new world of regulated OTC market and where the core execution activities take place.
What I find particularly useful is the historical comparison and aggregated activities by the dealers. It helps in producing and generating trends and signals that show where the market is most likely going to go.
If I can make one suggestion, that will relate it to the comparative statistics on trading activates of both SEFs vs. non-SEFs. This will indicate the overall patterns and changes in the market structure.
In general, well structured and presented report. Well done!
Igor
Yes, agreed it would be interesting to see the trend in SEV vs non-SEF. In fact you can see the total SEF (on facility) vs non-SEF (off facility) trends using the Clarus SDRView Researcher version. You can sign up for a free trial of that on https://www.clarusft.com/products/sdr-view/plansandpricing/.