One of our more popular posts is Gary’s Feb 2014 article on Fed Fund Swap Nuances, so I thought it would be interesting to look into What the Data Shows for these products.
First the highlights:
- USD OIS is the third-largest IR product
- $1 trillion gross notional was traded in July 2015 in the US (as reported to SDRs)
- With 669 trades in July that is an average trade notional of $1.5billion!
- Greater than 90% of volume is Cleared and 50% is On SEF
- SEF Market Share shows ICAP with 37% YTD, followed by Tullets with 25% and BGC with 23.5%
- Global Cleared Volumes show $3.3 trillion in July, with LCH SwapClear the leader (83% YTD)
- USD OIS in US SDRs represents 30% of Global USD OIS volume
Now all the details with charts, data and more.
USD OIS Swaps
In this article I will look specifically at USD OIS Swaps. These are short dated trades with a fixed leg and a float leg based on the Fed Funds Rate. In a future post I plan to look at USD FedFund Swaps, which are longed-dated and FF vs Libor.
Lets start by using SDRView to see the volume traded by US persons in July 2015 compared to other USD Interest Rate products.
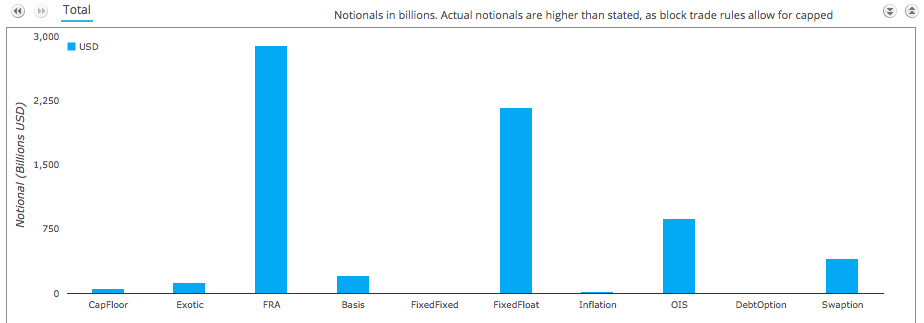
Which shows that OIS is the third largest product with >$900 billion gross notional traded.
Only FRA and FixedFloat Swaps with $3 trillion and >$2.2 trillion respectively are higher volume.
Breaking out July volumes using SEF and Cleared categories.
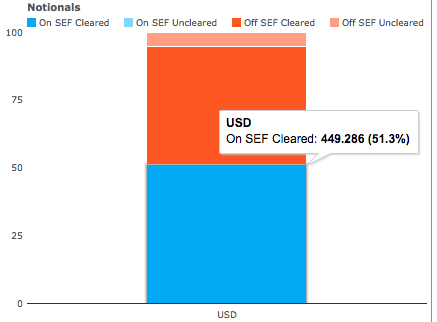
Shows that:
- On SEF Cleared is 51%
- Off SEF Cleared is 43%
- Off SEF Uncleared is 5%
And breaking out July volumes by tenor.
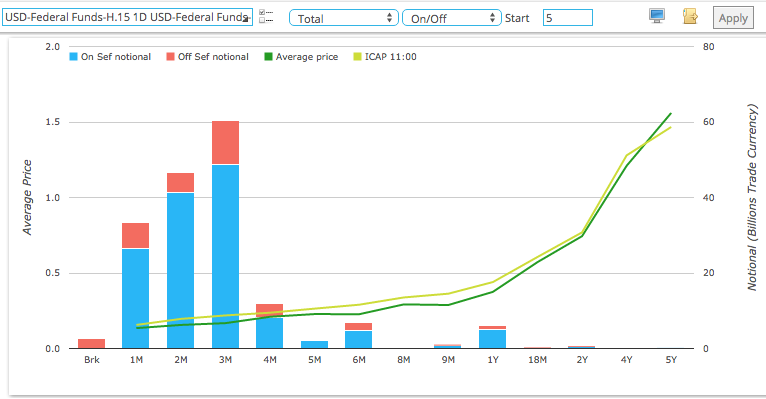
Shows that the majority of volume is 1M, 2M and 3M tenors, with some volume out to 1Y and less to 2Y.
While gross notional is significant, trade counts are low, just 669 trades in July, averaging only 30 trades a day and many tenors do not trade each day.
Making the task of sourcing input prices to USD FedFund curves a challenging one, given that it is common in USD to use o/n, 1w, 2w, 3w, then monthly OIS Swaps out to 1Y, then 18M and 2Y quotes in curve construction. As FedFunds is now the market standard USD discounting curve, the low number of actual trades observed is of some concern.
Volume Trends
Lets now use SDRView to look at monthly volume in the past year, first by trade count.
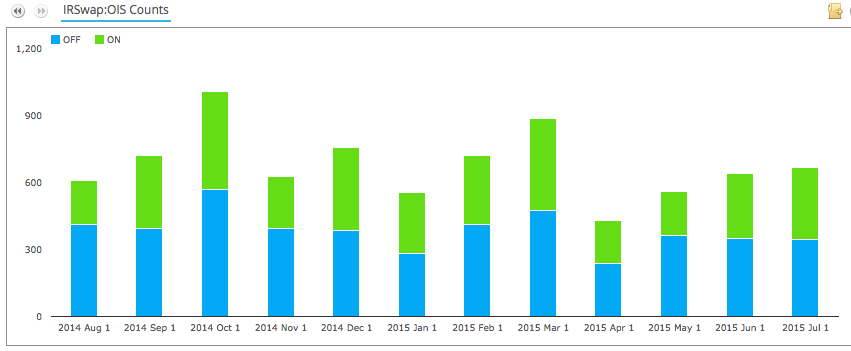
Showing that:
- Off SEF counts are slightly higher than On SEF
- July 2015 had 343 Off and 326 On SEF
- March 2015 was the highest volume in 2015
- Oct 2014 was the highest volume in the past year
And next the same period but by gross notional.
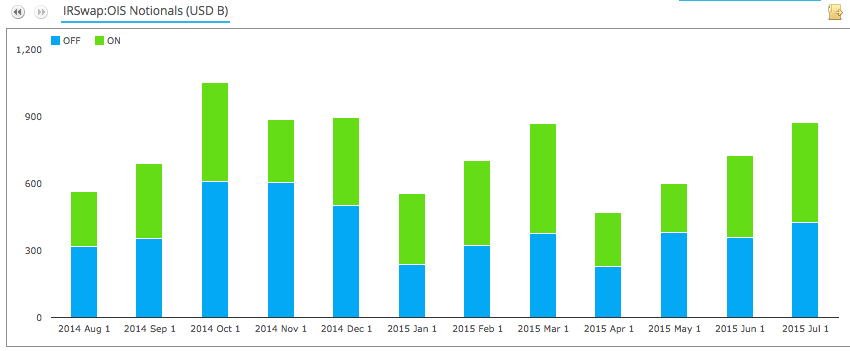
Showing that:
- Off SEF gross notional is usually less than On SEF
- July 2015 had $426 billion Off and $450 billion On
- July 2015 was the highest volume in 2015
- 2Q 2015 shows lower volume than 1Q 2015
- October 2014 has the highest in the past year
- 4Q 2014 is the highest volume quarter
Now we know that Capped Notional rules means that these volumes are under-stated, so lets split the above figures by how much is Standard (Actual Notional) and how much Capped.
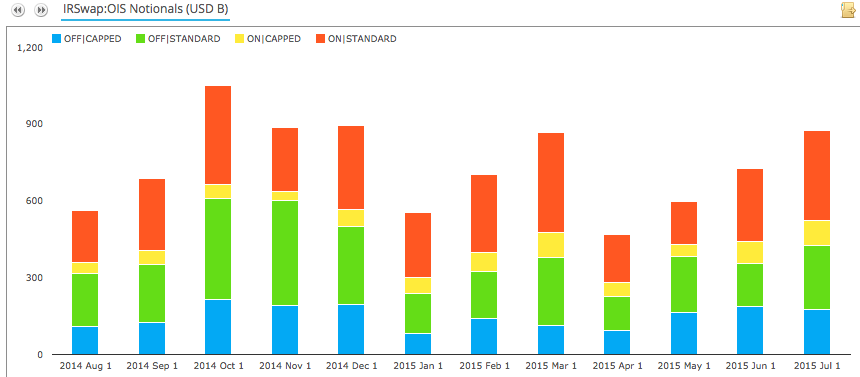
Showing that:
- Significant amounts are capped
- July 2015 Off SEF has $176b Capped vs $250b Standard
- July 2015 On SEF has $99b Capped vs $350b Standard
- The Off SEF Capped portion each month is much higher than the On SEF one
Is it possible for us to get a better estimate of the actual Notional traded?
Yes using SEFView, we know that $517 billion traded On SEF in July vs the $450 billion shown in SDR.
This is equivalent to saying that the $99b of Capped Notional was actually $166b of actual notional.
Using the same percentage for Off SEF, would mean increasing the Off SEF Capped $176b to $295b, meaning that a total of $545 billion traded Off SEF.
We can then estimate an overall total of $1.06 trillion in July 2015, with $545b Off and $517b On SEF.
As the number of trades was 669 in July, we can say the average trade size was $1.5 billion.
Clearly a wholesale market with a few large trades between major financial firms.
SEF Market Share
Lets now use SEFView to see which platform has the most liquidity.
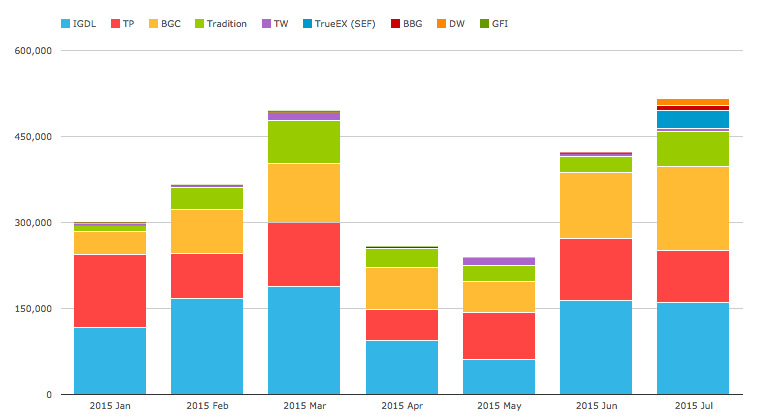
Showing that:
- IGDL is the leader (37% YTD)
- Tullets is second (25% YTD)
- BGC is a close third (23.5% YTD)
- Tradition next (10.5% YTD)
- D2D SEFs dominate volume with 96.4% YTD
- TrueEx did $32b of OIS compression in July
- TW and BBG show some volume each month
- DW also posted $13b in July, the first month in 2015 it has done so
- July 2015 is the highest volume month, just above Mar 2015
Global OIS Swap Volume vs US
So far we have been looking specifically at US persons volume reported to US SDRs.
A question of interest is how much of the market is outside the US?
Using CCPView we can get an estimate. Lets start by looking at Cleared USD OIS Swap volume.
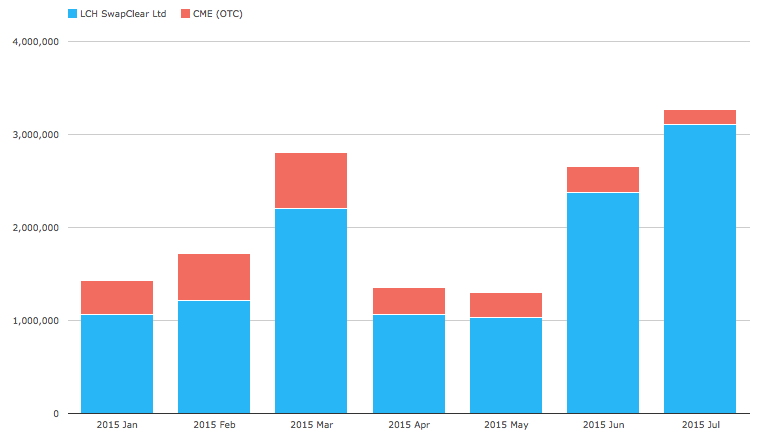
Showing that:
- Over $3 trillion was reported in July
- With LCH SwapClear having the vast majority (83% YTD)
- July was the highest volume month in 2015
- Then March and June
The actual figure for July 2015 is $3.27 trillion.
US ON SEF in July was $517 billion and Off SEF Cleared we estimate at $480 billion (using our earlier logic).
Resulting in a US total of $997 billion, lets call it a round $1 trillion.
So the USD OIS figures in SDR and SEF, represent 30% of the Global market.
This differs from USD IRS where we estimate SDR & SEF represent 50% to 60% of the Global market.
Thats it for today
It will be interesting to see how volumes develop.
Will the uptick in volumes in June and July carry into August and September?
Come back and see for yourself in SDRView, SEFView or CCPView.
Or subscribe to our blog to stay informed.