Following on from my article SEF, Oct2, What does the SDR Data show? I wanted to take a further look at what else we can observe in SDRView using the DTCC real-time price dissemination feed source.
USD IRS Prices on SEF platforms
From my last article you will know that we now have a SEF On and Off selection filter in SDRView Professional.
This means that we can compare Cleared USD Swap traded prices on SEF platforms versus Off facility.
The screenshot below shows for USD IRS On SEF for Oct 4, the volumes traded by tenor and an average price curve.
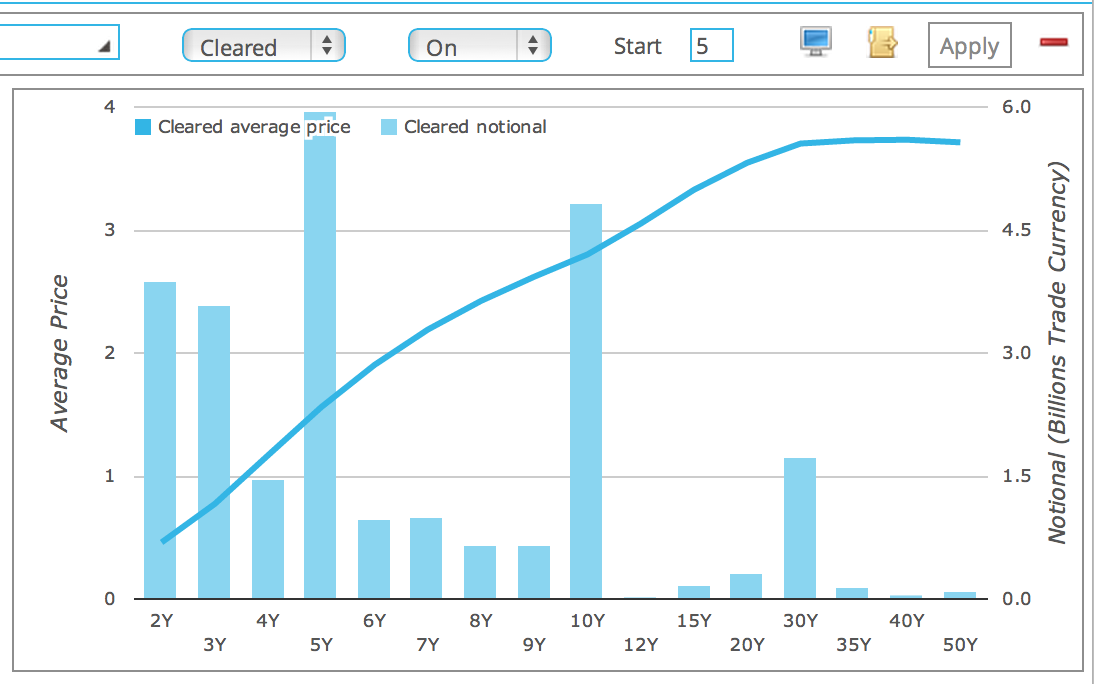
Now lets export this data and create some tables first comparing volumes.
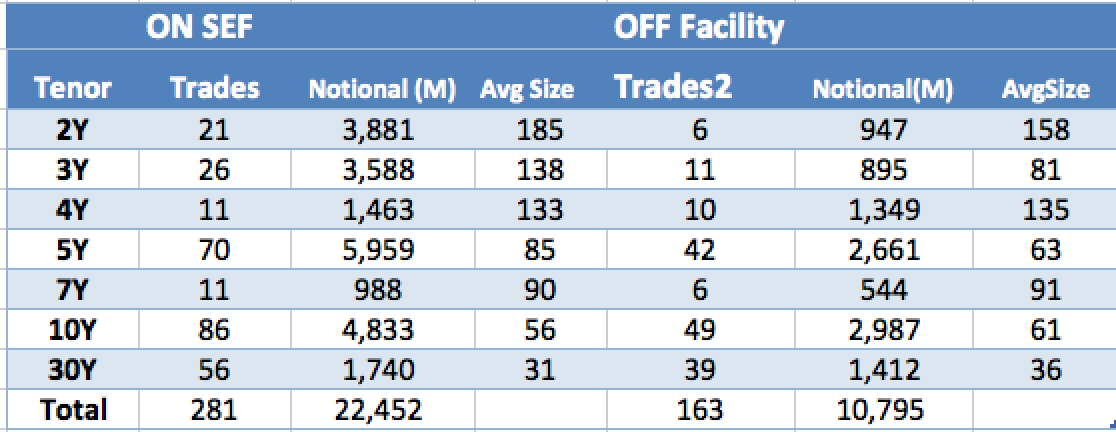
From this we can observe that:
- Similar to Oct 2, the volumes of On SEF are higher than Off Facility
- Both in terms of numbers of trades and gross notionals
- The proportion being roughly 2/3 to 1/3
- Average notional size is higher for On SEF below 5Y and less above 10Y
Lets now export prices and create a table comparing these.
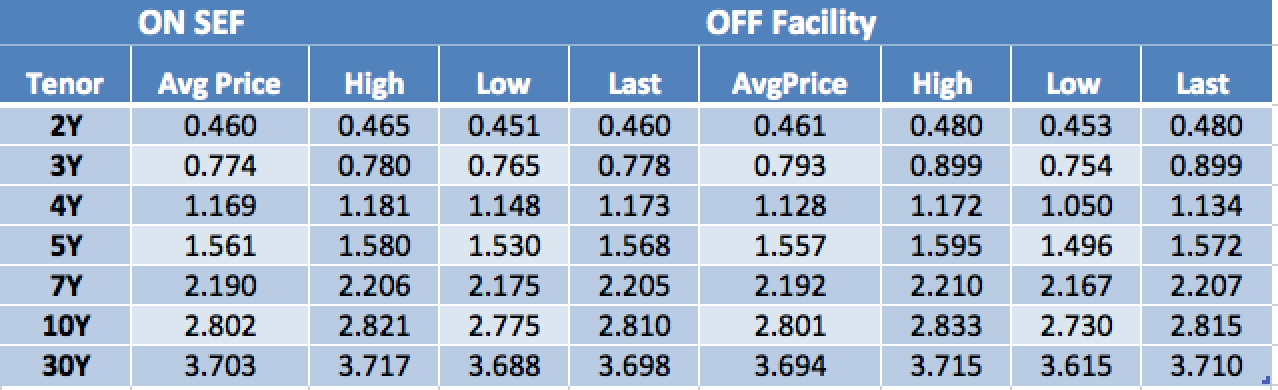
Well where do we start?
- Average prices for the super-major tenors of 2Y, 5Y, 7Y, 10Y & 30Y are within 1 bp for On SEF vs Off Facility
- Average price for 3Y differs by 2 bps and for 4Y by 4bps
- Which is surprising given both 3Y & 4Y have sizeable notional traded for both On and Off
- But is explained by the High and Lows
- So for Off Facility the High for 3Y and the Low for 4Y, both look away from the market
- And drill-down into these trades we see that they are actually prices from 3Y4M and 3Y9M tenor trades.
- Which we bucket into 3Y and 4Y for convenience
- But they then distort the 3Y & 4Y Average prices for Off Facility
- However we can easily use the Exclude toggle to remove these from our aggregation
- Which then brings 3Y & 4Y to within 1b
- Last traded prices for On SEF and Off facility are within 1 bps.
We could carry on and have much fun exporting data from SDRView Professional and analysing further.
However lets also not forget that SEFs themselves are now publishing their volumes and prices.
So as an example lets take the data that ICAP make available.
And create yet another table comparing this with the On SEF data from SDR.
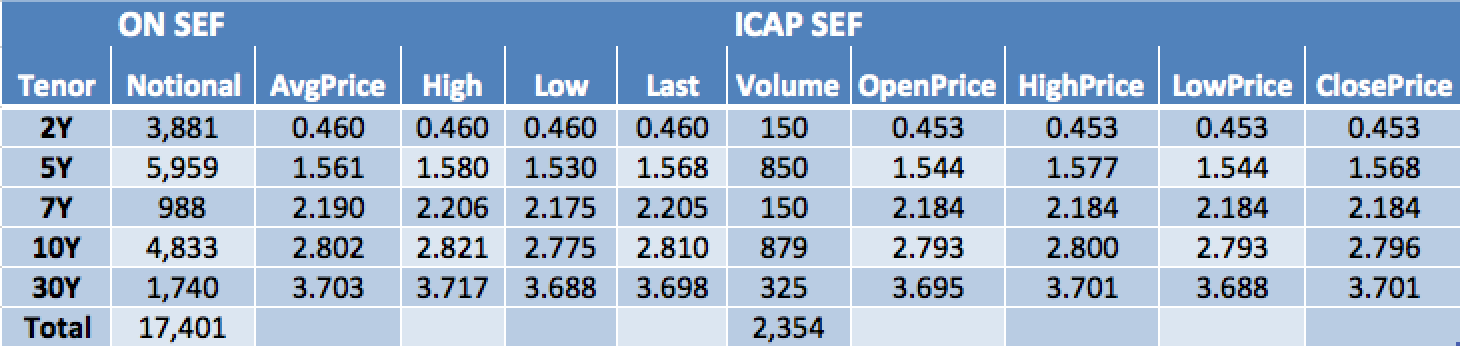
From which we can observe:
- ICAP SEF volume for these tenors is 14% of On SEF from SDR.
- Good agreement between the SDR Last price and the ICAP Close.
- Generally only a 1-2 bps difference
- Good but not as good, agreement between the High and Lows
Well I could go on.
Or leave you to follow the data yourself in SDRView.
I know which I prefer.