Continuing with our monthly review series, let’s take a look at Interest Rate Swap volumes in April 2015.
First the highlights:
- April 2015 volumes were the lowest since November 2014
- However 2015 YTD volume are up 47% from the same period in 2014
- SEF Compression volumes were also down from March
- FOMC meeting on April 28-29 once again generated price volatility, with the Swap Curve Steepening
- Global Clearing Volumes show LCH SwapCLear with 67% in USD vs CME with 33% and 90% to 10% for EUR
- SEF Volumes for USD, EUR, GBP IRS were $978 million in DV01 ($1,202m in March)
- SEF Compression activity was 16% of this with Tradeweb 52%, TrueEx 37% and Bloomberg 10%
- TrueEx posted $97 billion gross notional of compression, another strong month
- SEF RFQ/CLOB show Bloomberg retain its lead with 31%, the same as Q1
- Dealerweb+Tradeweb is next with 20%
- Tradition and ICAP follow with 17% and 15%
- Javelin did some MAC trades, the first trades on its platform in sometime
And there is more. So onto the data and details.
USD IRS On SEF
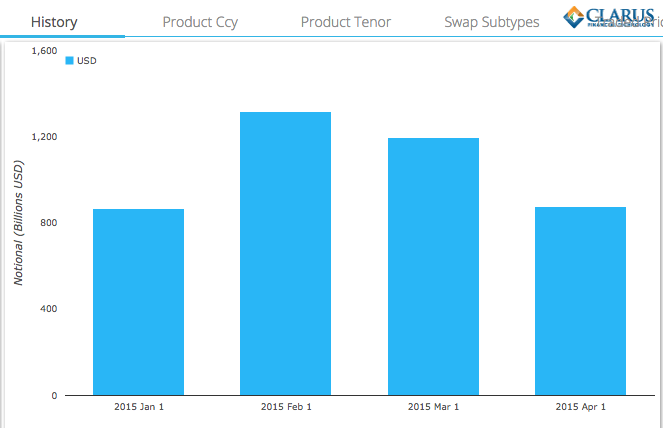
Using SDRView we see that >$1.15 trillion in USD IRS traded On SEF in April 2015, compared to $1.56 trillion in March. So a significantly lower number. Lets look at a chart. (Recall that SDR notionals are under-stated due to block trade capped notional rules).
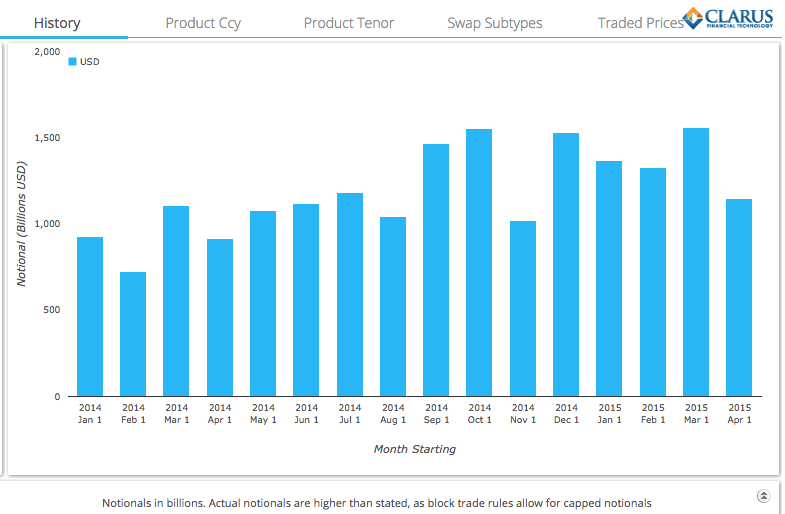
Showing that:
- April 2015 gross notional was $400 billion less than March 2015
- April 2015 volumes were the lowest in 2015
- However Comparing Year on Year
- Every month in 2015 has been much higher than the corresponding month in 2014
- In-fact Jan-Apr 2015 gross notional is 47% higher than the year earlier period
So while April was much lower than the (almost) record volumes in March, it still continued the 2015 upward trend.
SEF Compression Activity
As we are now able to identify SEF Compression trades in SDRView, it is worth looking at the figures for this in 2015.
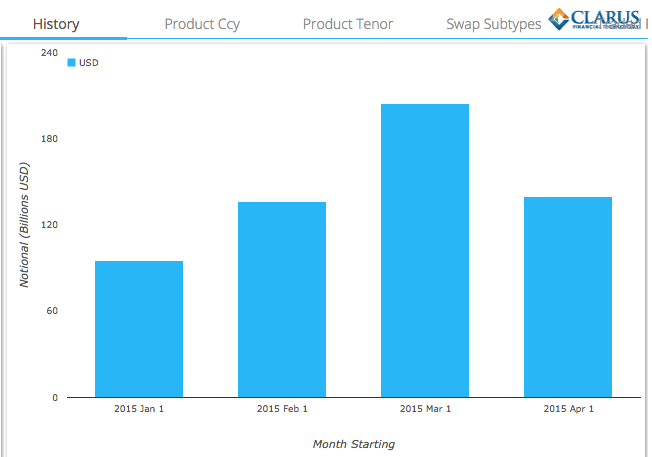
Showing that:
- April 2015 SEF Compression was $140 billion
- Much lower than the $204 billion in March
- So of the $400 billion difference between March and April, only $60 billion is explained by lower compression
- Feb 2015 SEF Compression was $136 billion
- So comparable to April 2015
- Yet we know that overall volumes were $180 billion higher in Feb 2015
So lets now look at the real price forming trades (Outrights, Spreadovers, Curves, Flys) for these months
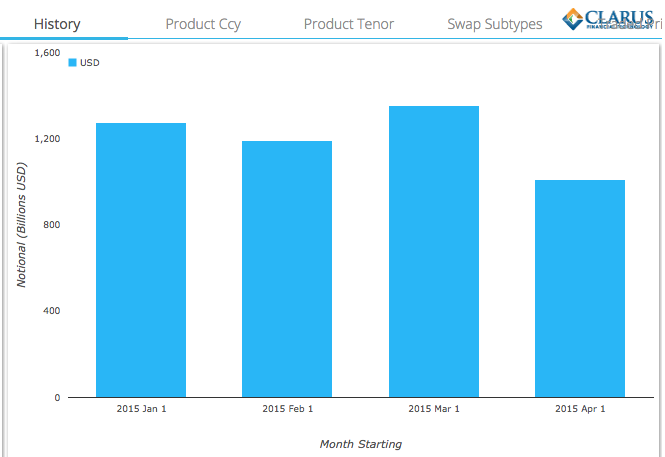
Showing that April 2015 gross notional is $1 trillion, which is far lower than each of the other months.
Volumes and Volatility
We would expect the lower volumes to have resulted from lower price volatility in the month. Using SDRFix we can see the monthly change in USD Swap Rates.
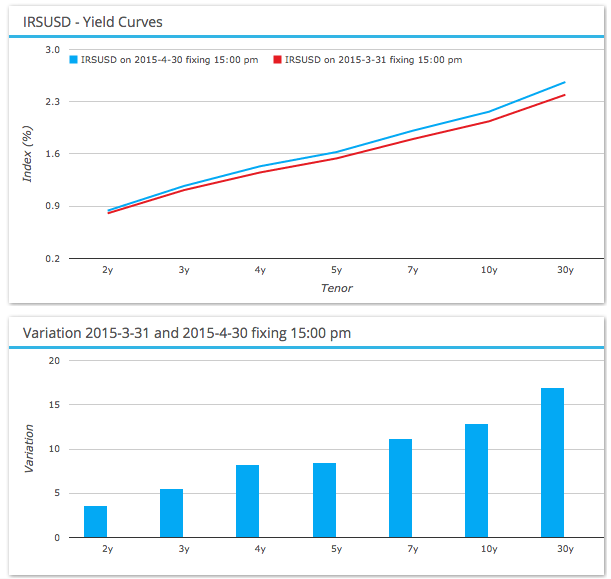
Showing that the Swap Curve:
- Steepened over the month
- With 2Y +4bps, 5Y +9bps, 10Y +13bps, 30Y +17bps
Certainly very different to the 8-12 bps fall we saw across the curve in March and the large +30bps move in Feb.
Most of this curve steepening came in the last 3 days of the month.
Good for those market participants on the right side of Swap Curve or Switch trades.
Bad for those participants that were hedged (for parallel moves) but exposed to long rates rising more than short rates. Steepener and Flattener Stress Scenario results were important this month.
And given that April 28-29 was the FOMC Meeting, an intra-day chart of 10Y Swap trades over the 3 business days 28, 29 & 30 April is very interesting.
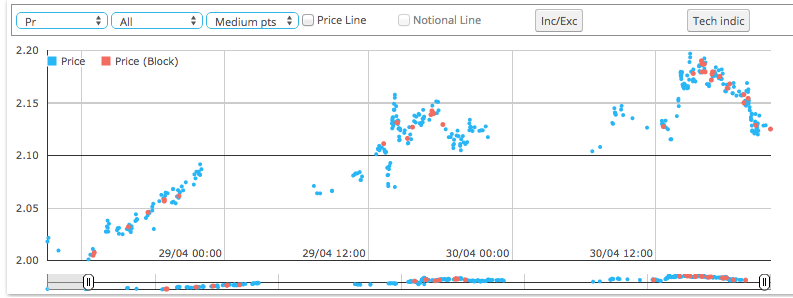
Showing that:
- Early on 28 Apr, 10Y traded at 2.005
- It moved up all day, with a final print of 2.0916
- 29 Apr opening trades were at 2.071 and 2.064
- Moved as high as 2.155 and last trade at 2.1175
- 30 Apr first trade at 2.104
- Then a big move at 8:44 EST to 2.1375
- High volume of trades (more blue dots)
- Highest price was 2.197 at 9:51 EST
- Lots of block trades (red dots)
- Then price falls
- Last trade at 2.125
So the move over the 3 days was +12 bps; close to the whole month’s move of +13bps. However the low to high over these 3 days was +19.6 bps. Lets hope no-one got caught on the intra-day swings.
USD IRS Off SEF
Now lets check what happened to Off SEF USD IRS volumes in April.
April volumes of $878 billion were lower than both March and February, but slightly higher than January.
Percentage of On SEF to Off SEF for April was 57% to 43%.
Global Cleared Volumes
Lets now switch from US to Global volumes by looking at Cleared Volumes in CCPView.
First USD IRS for the past 6 months.
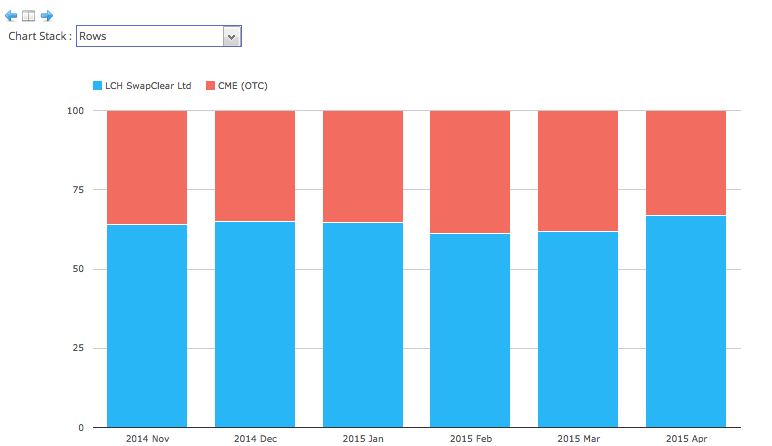
Showing that:
- LCH had 67% of the volume in April vs 33% at CME
- Which is an increase from the 62% vs 38% in March
The same chart but for EUR IRS.
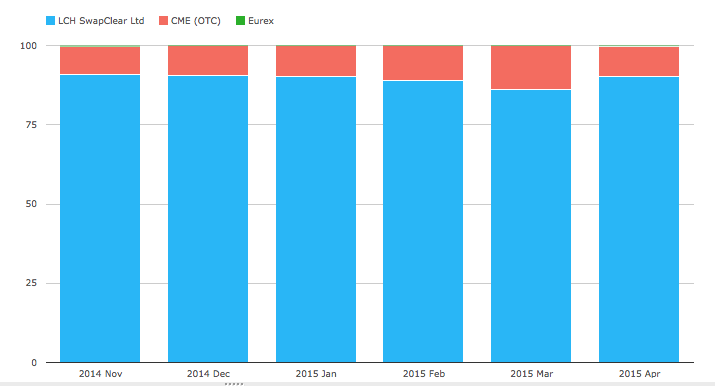
Showing LCH with 90.18%, CME with 9.66% and Eurex with 0.16%.
And looking at IRS in the main 6 currencies.
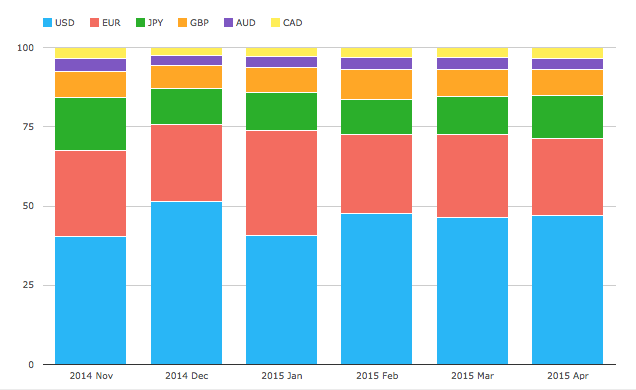
Shows that in April:
- USD is 47%
- EUR is 24%
- JPY is 13.7%
- GBP is 8%
- AUD is 3.5%
- CAD is 3.4%
Volumes by SEF
Lets now turn to SEFView and SEF Market Share.
Similar to March we will start by looking at DV01 (in millions) by month for USD, EUR, GBP by each SEF.
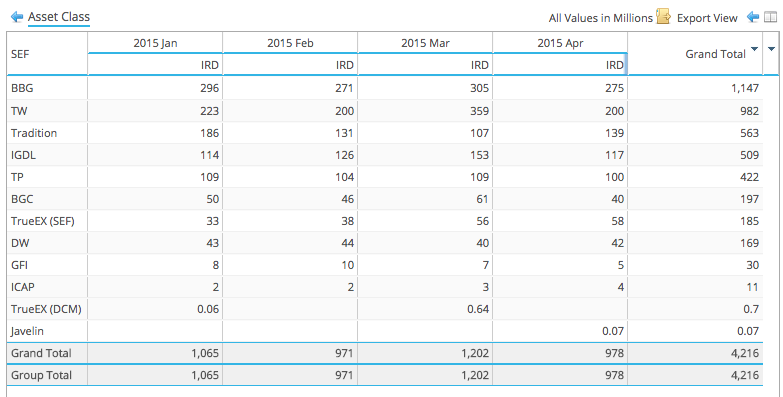
Showing:
- BBG is down from $305m to $275m
- TW shows the largest fall from $359m to $200m
- While March was a record month for them (IMM Rolls?) and Apr is only back to the Feb figure, it will be worth looking at the change in Compression volumes (more later)
- Tradition is up from $107m to $139m, perhaps the result of higher Curve and Fly activity in the month?
- IGDL is down from $153m to $117m, perhaps a sign of lower spreadover volumes?
- TP little changed
- BGC down from $61m to $40m
- TrueEx shows $58m DV01 in April, comparable to the $56m in March
- DW little changed
- GFI little changed
- Javelin with some volume, after many months of nothing
- With two 30Y MAC trades on 9-Apr of $15m each and one 2Y MAC trade on 30-Apr of $2m
SEF Compression
Looking in more detail into compression we can determine the following:
BBG publishes its compression volumes and April 2015 shows $27.6 billion gross notional (or $16m DV01) .
TrueEx also publishes its compression volumes and April shows $97 billion (compared to $129b in March). However the DV01 in each month is very similar, at $58 million and $56 million, implying that April compressions were for longer maturity trades than March.
TrueEx April figures can be broken out as:
- $57 billion gross notional compression at CME with $35.2m DV01
- $40 billion compression at LCH with $21.6m DV01
- $1.35 billion gross notional of RFQ on CME Cleared Swaps
- Which look like Curve or Fly trades on 9 Apr and 30 Apr
Tradeweb does not breakout its compression volumes (we keep asking), so we need to make some assumptions.
- TW has overall gross notional of $333 billion or DV01 of $200 million
- Assuming similar characteristics in block vs non-block and tenor to BBG & TrueEx
- We estimate $150 billion gross notional or $80 million of DV01 for compression
- So around 40% ratio of compression to overall volume
SEF Market Share
We can now look at SEF Market Share excluding Compression by creating a table for April similar to the one Chris did for March 2015. The amounts are DV01 in $ millions.
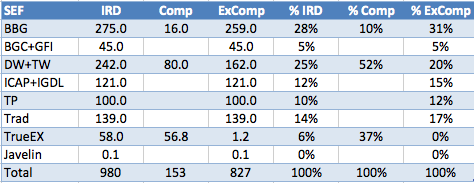
Showing that:
- Compression is $153m out of $980m, so 16% of overall volume.
- Tradeweb leads in Compression with 52%.
- TrueEx is next with 37% and then Bloomberg with 10%.
- Excluding Compression
- Bloomberg leads with 31%, same as Q1 share.
- DW+TW is next with 20%.
- Tradition and ICAP+IGDL are close at 17% & 15%
- TP has 12%, same as Q1
- BGC+GFI have 5%
The End
Thats it for this month.
Not massively eventful, but then given Easter, perhaps this is normal for April.
Lets see what May brings.
Which if the last 3 days of April are anything to go by, should be interesting.
No FOMC meeting till June 16-17, but there is the matter of Greece coming to a head in the Eurozone.
Fingers crossed for volatility and volume.