- How much of the USD Rates market is now traded versus Fed Funds (“EFFR“)?
- We run through the data and find that it really depends on how you measure it!
- Clarus, and most market participants, find that DV01 is the most accurate measure for Rates products.
This is a follow-up to an RFR Adoption blog that I wrote in November:
In that blog, I noted that Fed Funds seemed to be settling at around 10% of the USD market (excluding LIBOR, which continued to print in relatively large size every month in 2022).
However, last week I noticed the following Linkedin post that piqued my interest:
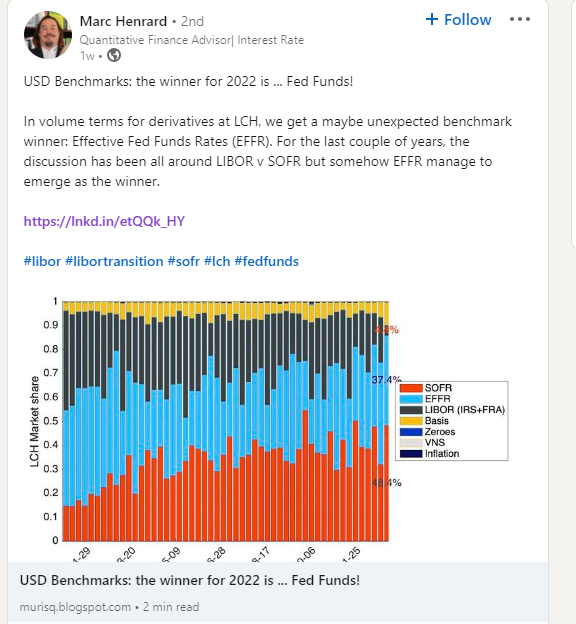
I thought I should present our Clarus data on Fed Funds and SOFR to see if we can shed any light on the data.
OTC Notional Data
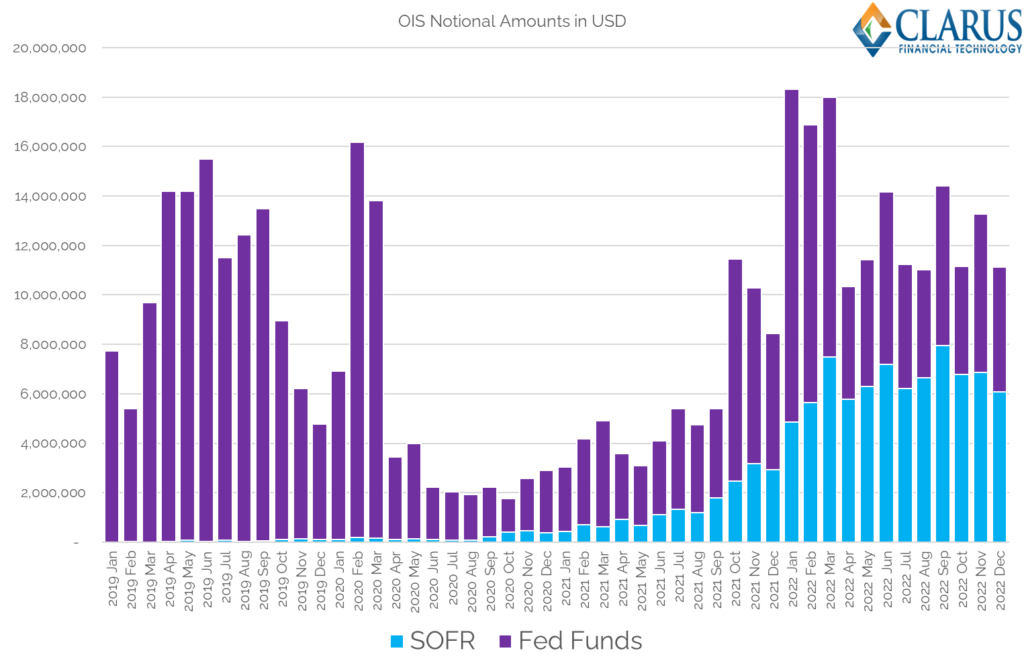
Let’s start simple. How have the notional amounts of Fed Funds and SOFR swaps evolved recently?
Showing;
- Notional Amounts of OIS cleared each month for the past four years.
- These are OTC notionals only – i.e. they exclude futures.
- As a note, SOFR has been around and we have been blogging about it since July 2018. Whilst it is a somewhat weird thought that I will have been blogging about SOFR for FIVE YEARS before LIBOR actually ceases, it also means we should now have traders in the market who may have only ever traded RFRs….!
- We can see that on a notional basis, the Fed Funds market was extremely active in Q1 2022, with volumes exceeding SOFR each month.
- As the year progressed, it looks like there was relatively less short-end trading and SOFR took over again.
- However, for the entire year, the notional amount of Fed Funds cleared was indeed higher than SOFR: $83.6Trn in Fed Funds plays $77.8Trn in SOFR for the entire year.
- Just to note that this data comes from the CCPs themselves, so these notionals are the full size, there are no complications around block trade sizes etc. Full sizes are disclosed. (Which also allows me to remind our readers that Block and Cap Thresholds will change this year in the SDR data).
This is perfectly in line with the previously mentioned Linkedin post, but does seem to fly against our analysis for the RFR Adoption Indicator (new data due soon by the way!). What gives?
OTC DV01 Data
As regular readers are no-doubt aware, we create the ISDA-Clarus RFR Adoption Indicator using DV01 data. We derive this from Clarus analytics, combined with a maturity split into standardised tenors from the CCPs themselves.
Whilst we mainly concentrate on these DV01 metrics, in reality a lot of analysis turns out to be interchangeable whether we are talking trends in notional amounts or trends in DV01 amounts. However, for OTC-cleared OIS in 2022, the trends were completely different on a notional and on a DV01 basis.
First, the chart:
Showing;
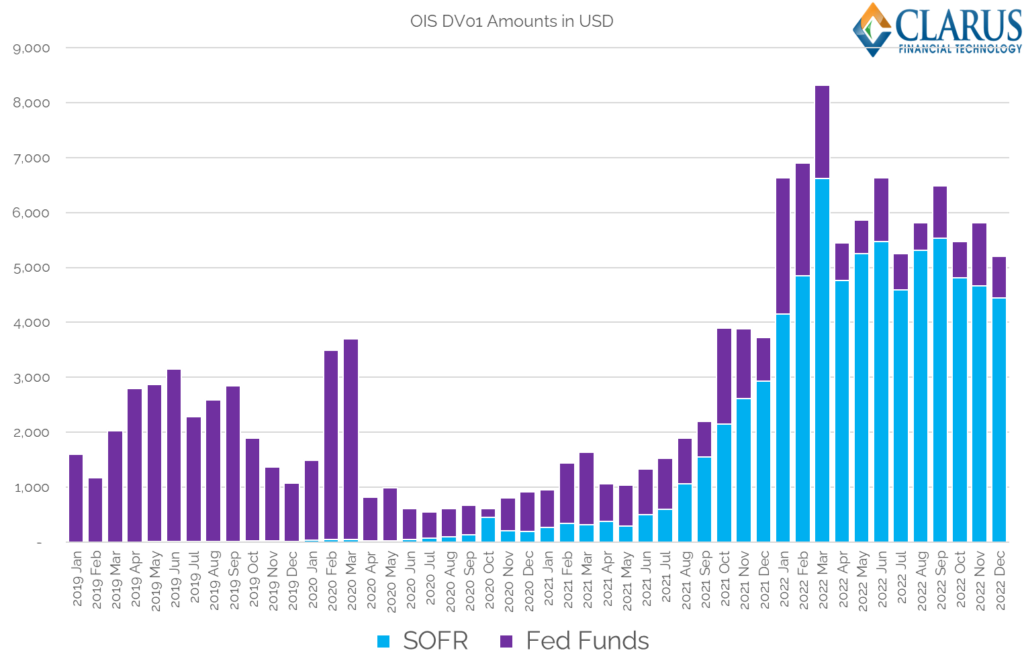
- DV01 Amounts of USD OIS cleared each month for the past four years.
- This chart looks very different to the previous one!
- SOFR has dominated the amount of risk traded as an OIS product ever since August 2021.
- The amount of DV01 traded versus Fed Funds is very volatile.
- Interesting to note that March 2022 stands out as the largest amount of SOFR risk ever transacted in OTC products.
- We have noted previously that the most amount of SOFR DV01 transacted across the market – i.e. including futures – was in September 2022. Something is going on there with IMM roll months, as more futures trading has transitioned away from Eurodollars and into 3 month SOFR IMM contracts.
- This OTC chart makes the adoption of SOFR look very strong indeed. And is very much in line with the end of year LCH press-release, which noted:
2022 was also a significant year for SwapClear ahead of the USD Libor conversion to SOFR in Q2 2023 – with more than 80% of all new USD swap risk cleared by SwapClear now SOFR-based.
Record clearing volumes at LCH with growth across services and regions; expansion of offering for the uncleared derivatives market
Overall Market
Finally, from CCPView, it is worth noting just how much OIS risk across both Futures and OTC products, is now traded. This is measured by DV01:
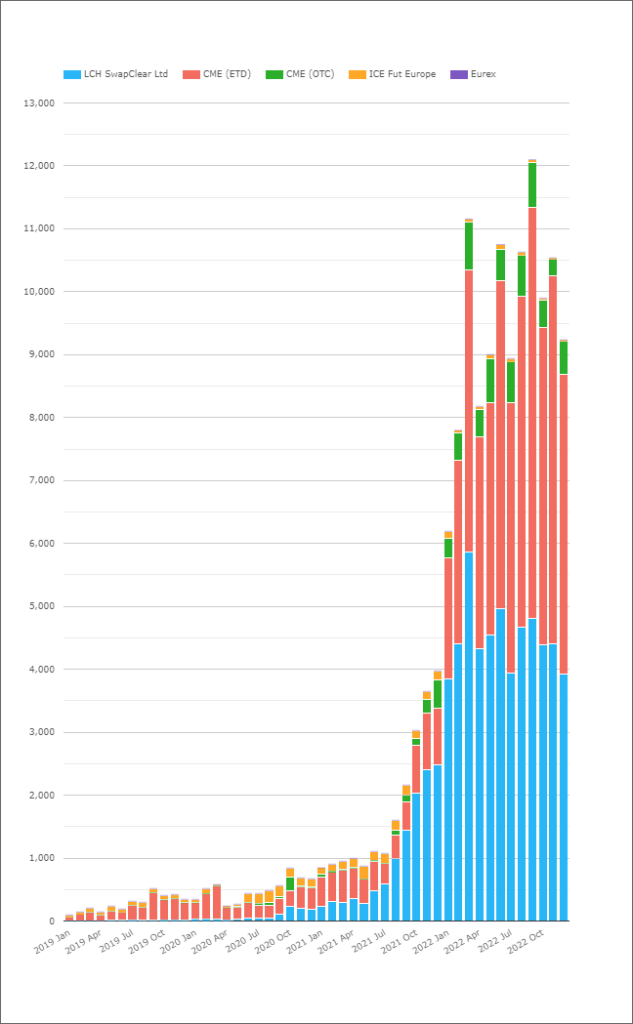
With some (a lot of?) USD LIBOR risk still lift to transition , those numbers are likely to climb higher throughout 2023.
In Summary
- The data behind LIBOR transition is important but can be complex.
- We aim to provide as much transparency as possible without boring people with too much detail!
- Yes, a lot of notional traded in Fed Funds in 2022 in OTC markets.
- This does not mean that transition from LIBOR is happening to Fed Funds.
- SOFR dominates the amount of risk traded in USD markets.
- This is consistent with what market participants and our readers tell us. It is also important that the data backs it up!
It seemed like the author was trying to make the case that if you look at volumes according to
– Notional statistics Fed Funds trades more than SOFR (or at least closer to SOFR volumes)
– DV01 statistics SOFR trades more
Is that correct?
Either way, is one reason DV01 and SOFR stats are so different, because SOFR trades are more heavily concentrated in the longer end where the Notionals tend to be smaller but the DV01s tend to be larger?
Thanks for the engaging articles!
Steve
Yes, I have the same read. The way I see it, FedFunds and SOFR serve different markets. Can’t say which is winning which.
Thanks for the Comment Steve. You are right – I just made it clear that we are talking about SOFR trading more longer-dated risk, where-as Fed Funds is predominantly a large notional, short-dated market.
Both the notional and DV01 data relates to new trades, right? Is there comparable data for open interest? Trades are important in their own right, but trades that build up, maintain, or unwind positions are significantly different things.
Thanks for the comment! We have notional Open Interest data for all of the CCPs in CCPView – we can certainly investigate that data. Is there a particular reason that Open Interest should have a different profile to new activity? I have typically been happy to assume that new activity is a decent proxy for the maturity profile of Open Interest as well. Intuitively, it is possible that there is e.g. a load of 30Y activity at some point in time, and that this lingers around for a while as Open Interest whilst not really trading any new volume. But doesn’t that only apply for illiquid parts of the curve, that would have relatively small amounts of risk traded against them?
(completely forgot to reply, apologies)
I have a very limited window into swap trading, but what i see is mostly holding opportunistic positions for days or weeks. This generates a lot of volume, but contributes zero to net open interest. I appreciate that other participants are behaving very differently. And i would expect different mixes of activity for different shapes of swap: spot-starting more likely to be held until termination, forward-starting, especially IMM-starting or meeting-dated, more likely to be traded in and out of? That varying mix would mean a variable relationship between volume and open interest. Whether it varies significantly, though, i have no idea!
Thanks for the post that complement in a very useful way my original post at https://murisq.blogspot.com/2023/01/usd-benchmarks-winner-for-2022-is-fed.html
Unfortunately the CCP do not provide the DVO1 weighted volume. Even the bucketed numbers by maturity tranches are provided only for SOFR (not for EFFR), so the comparison using easily available public data is not really possible.
It would be also interesting to do the same comparison adding ESTR. Obviously ESTR is in a different currency and EURIBOR is not disappearing soon. But ESTR typically has more weekly volume than SOFR and has probably a maturity profile closer to EFFR.