I take a look at the volume data for July 2022 in CCPView to see whether we have now hit the quiet weeks of summer trading.
Cleared OTC Rates Volumes
As always, Cleared Rates markets provide a great barometer of overall market activity. They are the largest OTC markets and the most transparent.
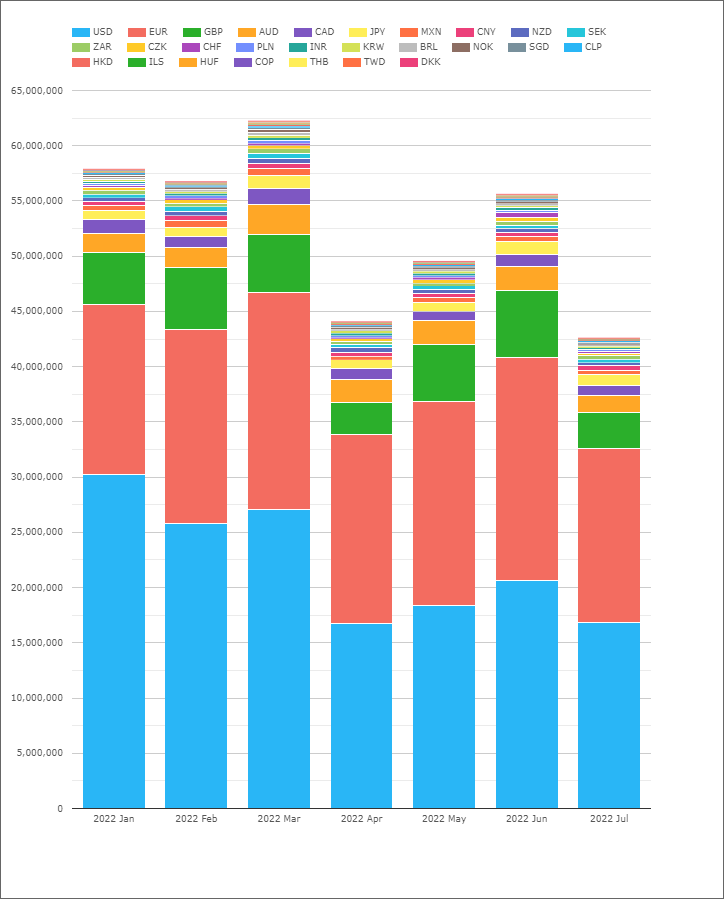
Showing;
- Notional volumes in millions of USD of cleared OTC Rates derivatives across all currencies.
- July 2022 was indeed the lowest volume month of 2022.
- Total volumes were 22% lower than the average in H1 2022.
- Volumes in July were within ~3% of April volumes (which we noticed at the time were unusually low).
- Volumes in USD were roughly the same in both April and July this year.
- Across all currencies, 12 out of the 27 cleared currencies saw their lowest volumes of the year.
- Relatively small markets such as CLP and CNY were the only “outperformers”, returning their second largest notional volumes of the year during July 2022.
Cash Treasuries
How about non-derivative markets? We collect FINRA-TRACE weekly volume data for US Treasuries as well.
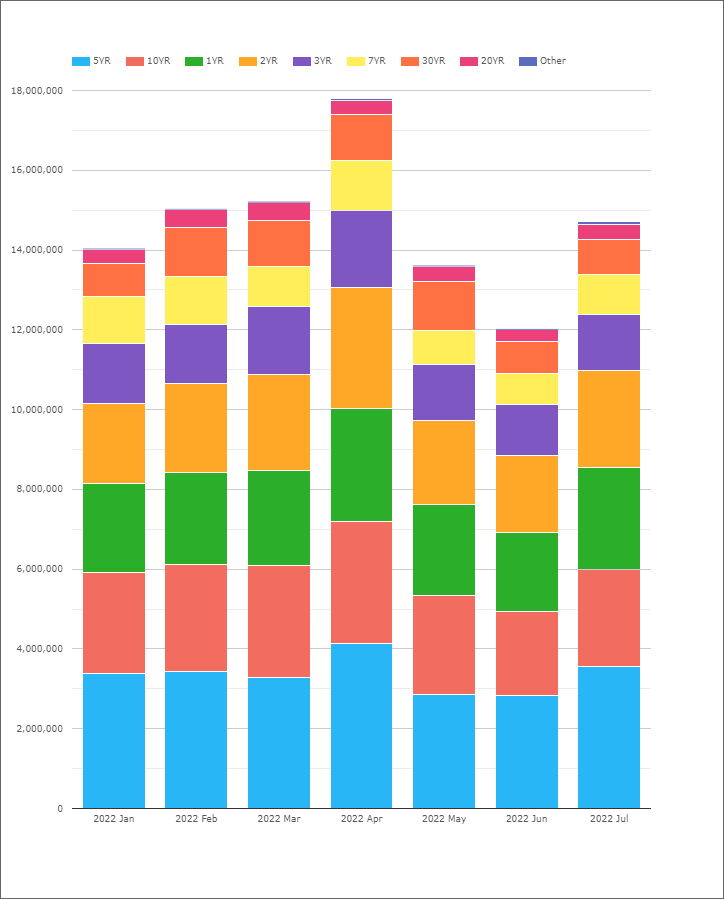
This seems to tell a significantly different story. The chart shows;
- Notional volumes in millions of USD of US Treasury nominal bonds, TIPS, Bills and FRNs. Most of the activity is in vanilla bonds.
- July 2022 certainly wasn’t a quiet month in terms of volumes traded!
- However, the tenors that had relatively large volumes were 1Y, 2Y and 5Y, all recording their second largest volumes of the year during July 2022.
- 10Y volumes were about 10% down on their H1 2022 average, the second lowest of the year (after June).
- Interestingly, 30Y volumes were higher than during both January and June this year, but were some 25%+ lower than February-May time period.
Futures
Exchange Traded Derivatives, aka Futures, all tend to be dominated by CME in Rates space. CCPView shows the monthly volumes across a large number of Rates contracts:
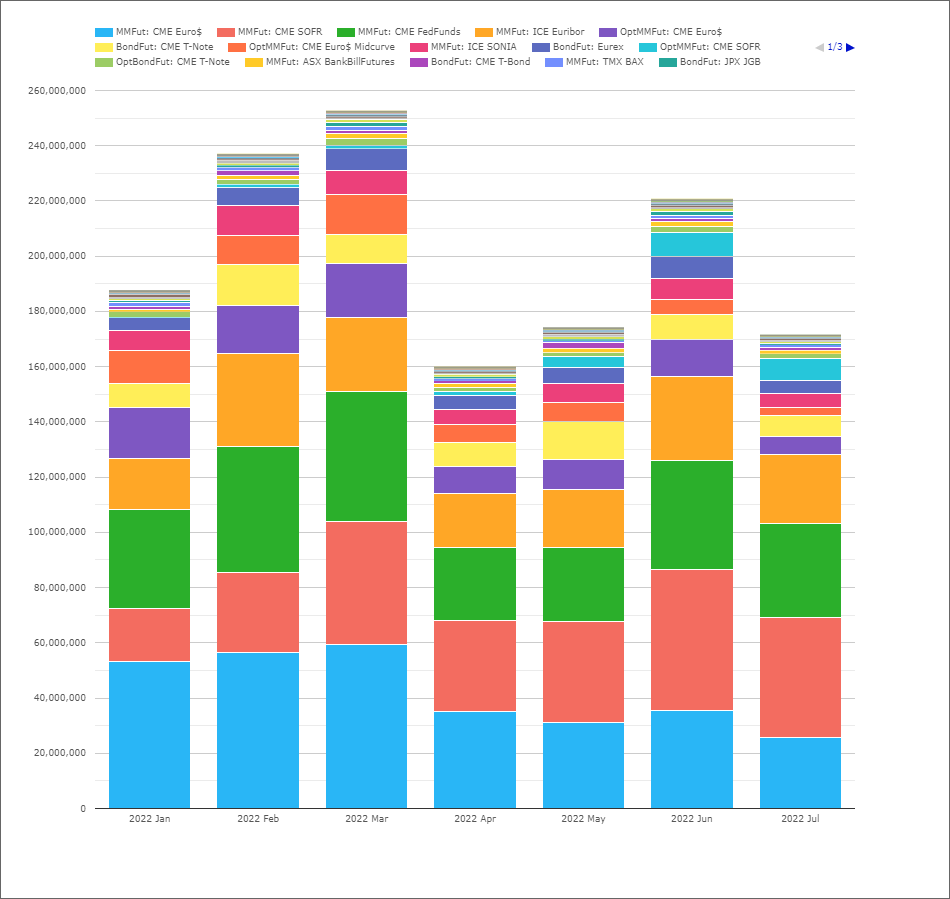
Showing;
- Notional volumes in millions of USD of Exchange Traded Derivatives across Rates products such as money market futures (STIRs) and bond futures.
- Volumes are largely driven by Eurodollars – which are increasingly transitioning into SOFR volumes, which is a nice trend to see.
- Bearing in mind that June is a “roll month” for these IMM dated contracts, the ~22% drop-off into July volumes is not huge.
- July volumes were larger than April this year and very similar to May (within ~2%) across Eurodollars, SOFR and Fed Funds contacts. Not much of a Summer lull here!
Credit Derivatives
Turning to other asset classes, cleared OTC Credit Derivatives have had to contend with a Russian default and large price corrections already in 2022. Do they need to take a breather?
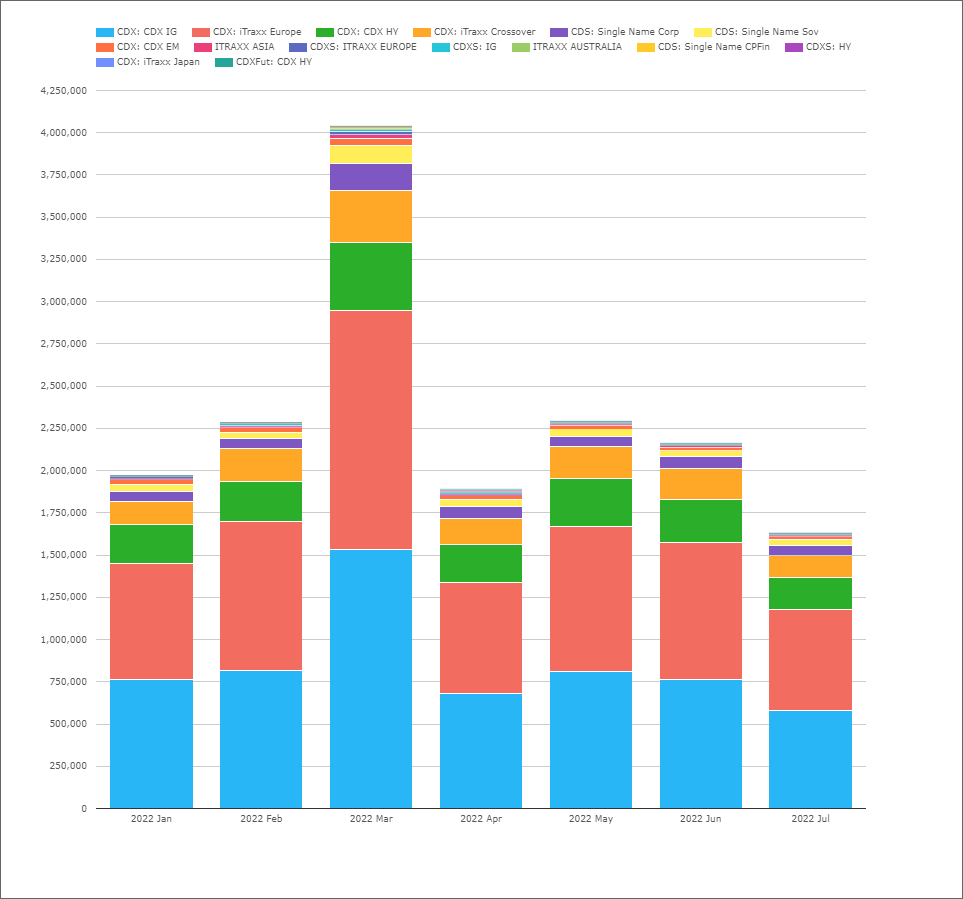
Showing;
- Notional volumes in millions of USD of Cleared OTC Credit Derivatives.
- I think the chart highlights well that monthly volumes were considerably lower in July this year than any other month.
- March volumes were driven by the roll activity that occurs for standardised contracts (plus all the market volatility at the time!).
- July 2022 activity is some ~25% lower than all other months in 2022. A real Summer lull in these markets is evident.
FX
The market that never sleeps. Has there been a decrease in cleared FX activity this month?
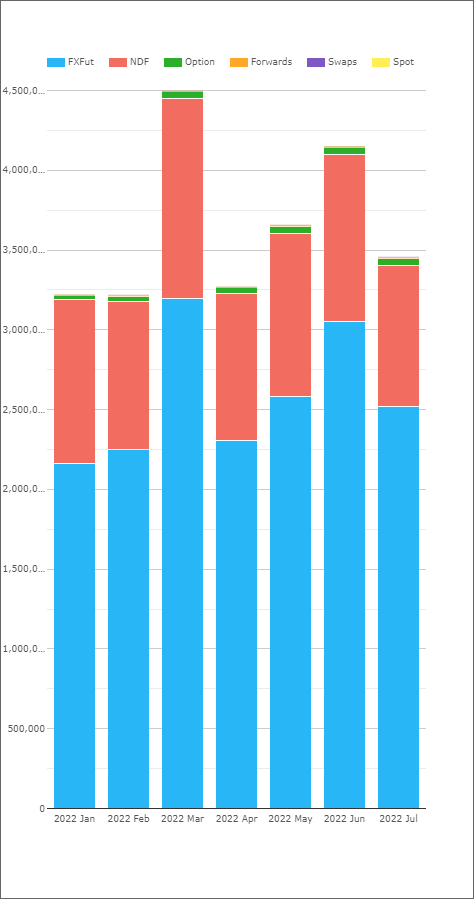
Showing;
- Notional volumes in millions of USD of Cleared FX Derivatives.
- Cleared FX derivatives cover NDFs, FX Futures and cleared FX Options, spot, forwards etc.
- Activity in July was within ~5% of June traded volumes. June was the 2nd largest month this year.
- We certainly see spikes in volumes due to the roll of IMM FX contracts in March and June.
- However, different trends present themselves:
- NDFs saw their lowest volumes of the year in July 2022.
- FX Futures saw decent volumes in July, beating all non-roll months in 2022 apart from May. They also seem to be on an upward trend – one to watch.
- Cleared Forwards, whilst small in comparison, also seem to be on an upward trend.
Inflation
Finally, I wanted to follow up on our recent Inflation articles to look at these volumes specifically:
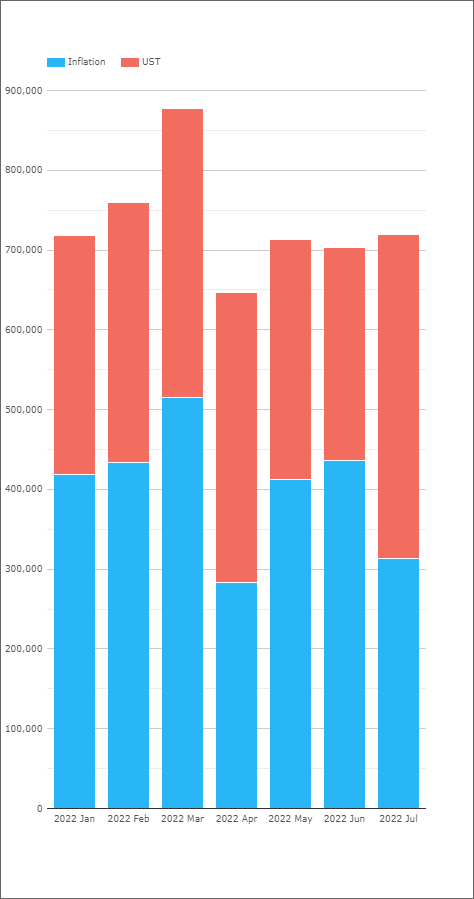
Showing;
- Notional volumes in millions of USD of cleared OTC Inflation Swaps and US TIPS cash bonds.
- We like everyday to be a school day here on the Clarus blog! I, for one, certainly had no idea that the size of the USD TIPS market was quite so large compared to the combined sizes of the USD, GBP and EUR inflation swaps markets. The chart below is split by currency across all products (swaps and TIPS):
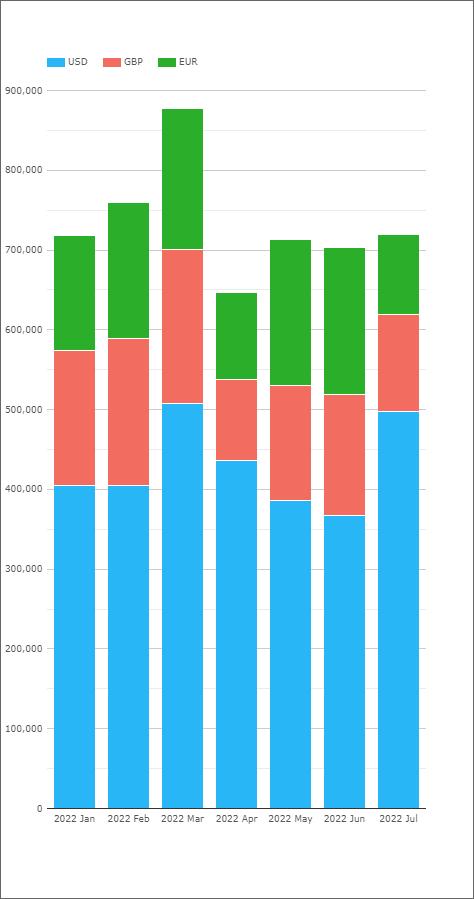
- As we can see, total volumes in USD-linked inflation products were at peak-2022 volumes in both March and July 2022.
- These volumes in USD-linked products are much larger than just the EUR or GBP inflation swap markets.
- I don’t have data on how large the underlying inflation bond markets are for EUR and GBP. DO any of our readers have the data? It would be an interesting comparison given that both the EUR and GBP Inflation swap markets are larger than USD in an average month.
- Given the focus on inflation, volumes are likely to stay elevated throughout 2022.
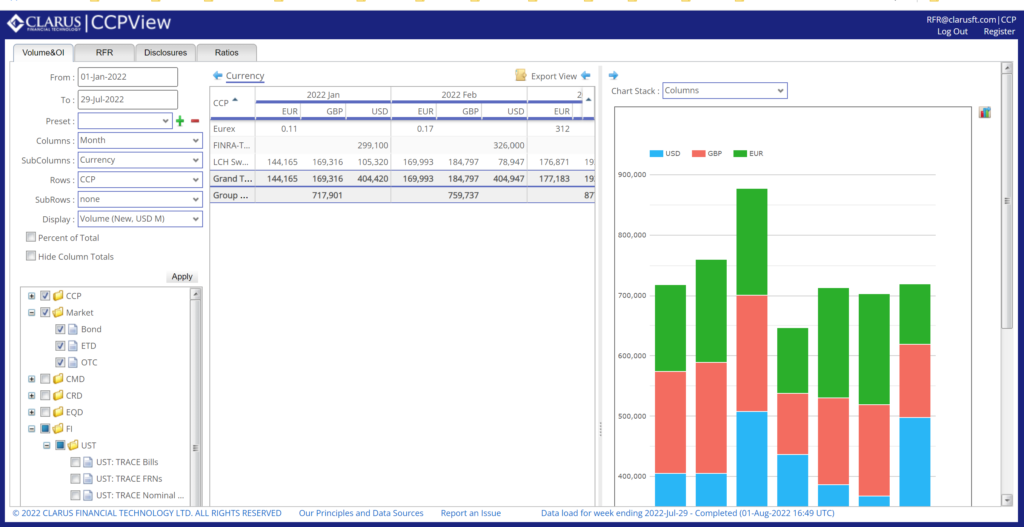
CCPView
All charts and data were taken from CCPView for today’s blog. Check out the CCPView’s in-depth data coverage and contact us for subscription options anytime.
Knowing when markets are active or subdued can be important when performing liquidity assessments and trying to move any size of risk through markets. We believe that our data can help you accurately assess market conditions.
In Summary
- A summer lull is evident in some markets whilst others see elevated activity.
- Overall OTC Rates activity has been subdued, outside of some currencies such as CLP and CNY.
- However, US cash bond and inflation trading has been very active.
- Credit derivative markets are taking a breather after a truly hectic H1 in 2022.
- FX cleared derivatives are showing positive trends in FX Futures and cleared Forwards, but NDF volumes have trailed off in July 2022.