- Canadian Rates markets look to be in an especially strong place from a market infrastructure viewpoint.
- CAD IRS trades versus a term rate, CDOR, which is based on real quotes from six panel banks.
- The underlying market for CDOR, Banker Acceptances, is a growing market of significant size (CAN$85bn outstanding).
- Meanwhile, OIS trading vs CORRA in CAD OIS is popular. Over half of cleared volumes in CAD are OIS products.
- CORRA is undergoing reform. Enhanced CORRA will be based on up to CAN$20bn in overnight repo transactions from next year.
CAD Rates Trading
We have (unintentionally) neglected the CAD IRS market in our Clarus Blog, with only two previous entries (here and here) looking at DTCC Canada.
This week’s entry will try to somewhat redress that balance.
From a market structure perspective, I learnt two important things when researching this blog:
- CAD CDOR (the floating index used in IRS) is already a quote-based market rate and therefore largely exempt from the problems we see with LIBOR-based markets. Could it act as a template for other markets?
- CAD markets already trade over 50% of notional in OIS products. I had no idea CAD OIS (CORRA) was so large relative to IRS.
Canadian Rates Markets
As an outsider at an international bank, I always found both CAD IRS and CAD XCCY (“Bills-Libor”) very difficult to trade. That might just have been me, but I sure wish we had more material like the Bank of Canada “Primer on the Canadian Bankers’ Acceptance Market” back in the day. Written last year, it is well worth a read.
From the Executive Summary:
The BA market is intrinsically linked to CDOR, which was originally developed to establish a daily benchmark reference rate for BA borrowings. This rate is quite nuanced compared with rates in other jurisdictions in that it is not directly a bank borrowing rate. Instead, it is a committed lending rate at which banks are contractually willing to lend cash to corporate borrowers with existing BA facilities. CDOR is also used as the main interest rate benchmark for calculating the floating-rate component of both over-the-counter and exchange-traded Canadian-dollar derivative products.
A Primer on the Canadian Bankers’ Aceptance Market, Bank of Canada Staff Discussion
The paper provides an essential overview of the CAD market, which I try to summarise below:
- The CDOR fixing is an average of Bankers Acceptances (BAs) quoted each day by six submitting banks.
- CDOR was invented to facilitate a reference rate for syndicated BAs but also became the reference rate for interest rate derivatives.
- These BAs have a total notional outstanding of around CAN$ 80-85bn.
- This notional outstanding has increased by 70% since the trough in 2010 following the financial crisis.
- Total BAs at each of the six banks range from CAN$8-14bn outstanding. Therefore, a drawdown of +/- 2bn can have a material effect on the price of BAs.
- The secondary market for BAs has grown to stand at over CAN$250bn per month in 2018.
- 90% of BA issuance is for 1 month (and under), the remainder being 1-3 months.
- Transparency information regarding the volumes of BAs traded used to be available weekly. This now seems to have shifted to monthly. Shame.
- BAs are now more capital intensive to hold. Anecdotally, there is a suggestion that dealers reduce BA inventories at month- and quarter-ends, increasing BA yields.
A a bit more detail on CDOR (Canadian Dealer (né Dollar) Offered Rate), which I state verbatim:
CDOR represents the rate at which the submitting bank would be willing to lend (offer) funds against primary BA issuances with terms to maturity of approximately 1, 2, 3, 6 and 12 months to clients with existing credit facilities that reference CDOR. This represents the bid side of primary BA issuance. It is worth noting that the submitted CDOR rate is not specific to a type of borrower or an amount but is, rather, a benchmark rate for each respective tenor. This contrasts with the offer-side rate (for cash BAs), which is the secondary market rate offered by banks to entice investor demand and manage BA inventory levels once the BAs have been issued.
A Primer on the Canadian Bankers’ Aceptance Market, Bank of Canada Staff Discussion
Finally, there is an interesting section about why CDOR-OIS basis is persistently high, despite Canadian banks having a consistently strong credit standing. It’s worth a read (hint: HQLA requirements):
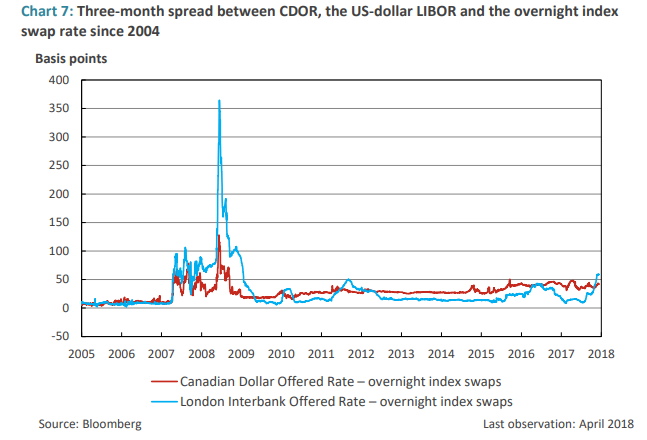
A Primer on the Canadian Bankers’ Aceptance Market, Bank of Canada Staff Discussion
CAD IRS Trading
With that background in place, it’s time to take a look at the CAD Rates market itself from SDRView and CCPView.
Showing;
- Monthly volumes in cleared Fixed vs Float CAD IRS have peaked at CAN$1trn in the past year.
- LCH SwapClear dominates.
- CAD is the sixth most traded currency by notional at LCH, sandwiched between NZD (7th) and JPY (5th) when measured by vanilla Fixed-Float IRS.
From SDR data, we see that 92% of the CAD swaps (September 2019) were traded versus 3 month CDOR. This is despite the fact that most BAs are issued with a maturity of 1 month or less. That might be something worth looking at in the future…
In terms of DV01 (risk) traded by maturity, we see that the typical 2y, 5y, 10y and 30y tenors dominate trading activity:
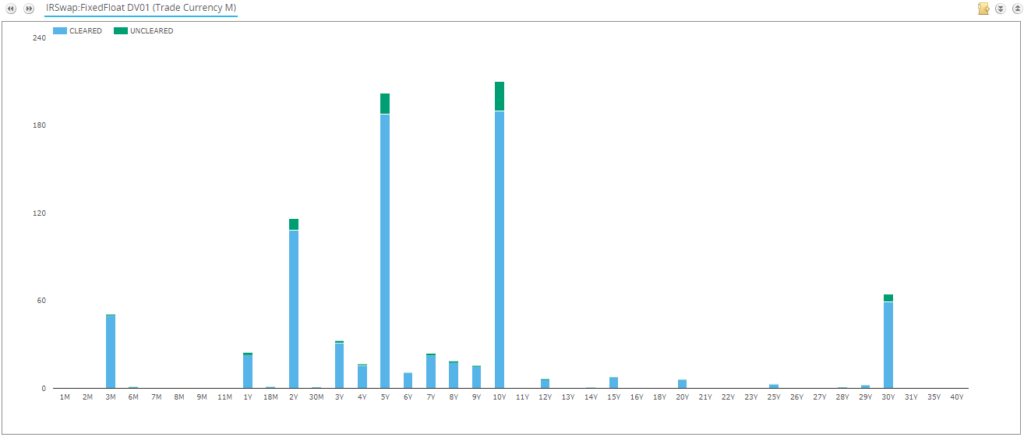
In addition, 92% of risk has been reported as Cleared (excluding DTCC_CA data – see our previous blog).
Now, when I ran the LCH figures including both IRS and OIS, I discovered that CAD becomes the fifth most traded currency. Which leads us on to…
CAD CORRA Trading
Using CCPView, I looked at CAD OIS trading in relation to CAD IRS. Recall that CAD OIS is mandated by the CFTC and the CSA (Canada) to clear out to two year maturities.
Showing;
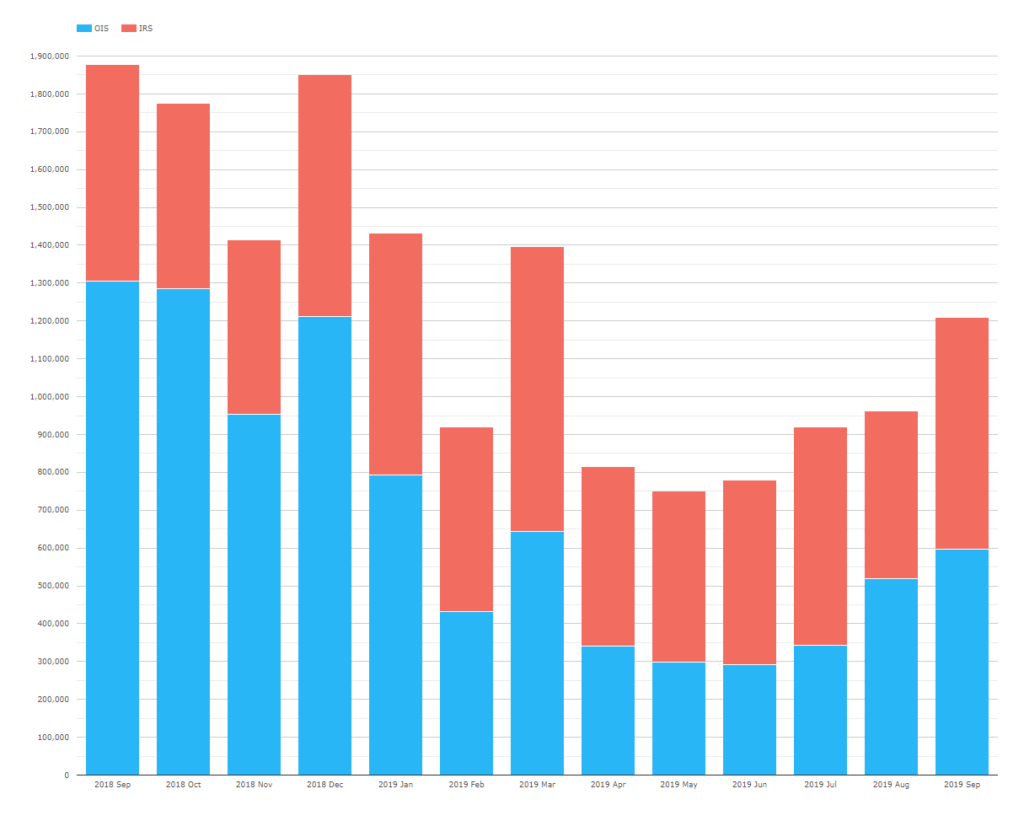
- Volumes in CAD OIS are at least as large as CAD IRS each month.
- In fact, OIS volumes make up 53% of overall Rates traded. This is only just shy of the USD figure at 58% – and we are pretty certain that USD OIS trading is being fueled by monetary policy rather than underlying structural shifts.
- CAD OIS volumes topped out at $1.3trn per month last year.
- Surprisingly, they have since reduced dramatically to less than half.
- This is probably as a result of the BoC hiking rates in Q3/Q4 of 2018 and since being on hold.
What is CORRA?
With a decent understanding of volumes in CAD markets, I still had a remaining question.
What exactly is CORRA and is it being subjected to the same scrutiny as other Risk Free Rates?
So, CORRA as it stands right now is:
- The Canadian Overnight Repo Rate Average (“CORRA”).
- Volume weighted average of Overnight repos versus general collateral in Canadian Government bonds.
- Interdealer transactions only.
- Administered by Refinitiv.
- Published T+1 at 9am Eastern time.
Interestingly, in the event that less than $CAD500m on any day trades, then CORRA falls back to the Bank of Canada target rate. That seems such a sensible fallback that I’m surprised more RFRs don’t incorporate it. I wonder why not?
CORRA Reform
And yes indeed, there is a process on-going to reform CORRA. Despite it starting in a very healthy position, there is a Working Group in Canada that ran a consultation in Q2 2019 to enhance CORRA. The consultation focused on:
- Should Tom-Next Repos also be included in CORRA?
- Should repo transactions from all market participants be included?
- Should CORRA continue to exclude “specials” and look only at GC?
The Bank of Canada have also announced that they will become the administrator early next year, replacing Refinitiv. In the same release, the BoC state that “enhanced” CORRA will be available from Q2 2020.
The results of the consultation are summarised below:
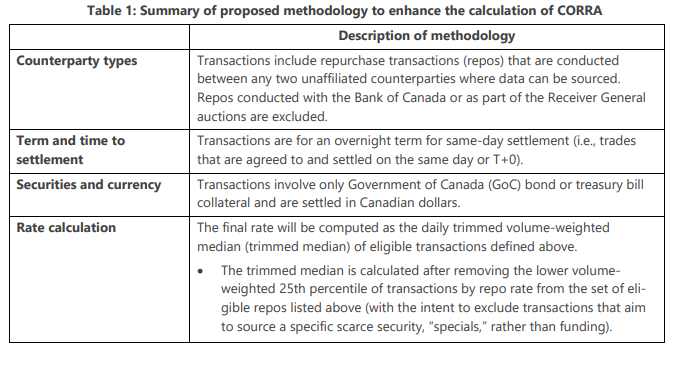
It is probably most interesting to note that Tom-Next repos will continue to be excluded from Enhanced CORRA. This is despite Tom-Next representing 30-45% of the overall repo market by volume (Box 1 here).
It is noted in the consultation response that the increase in market participants included in the Enhanced CORRA will now mean that daily volumes will be around $CAD10-20 billion for the calculation. That seems enough to avoid any complications from including Tom/Next trades as well.
CAD Market Overview
Despite my own personal difficulties trading it (!), CAD markets are in an extremely healthy place from a market infrastructure perspective:
- IRS trades versus a quote-driven term rate, the underlying of which is growing with up to CAN$85bn outstanding.
- The OIS index is a risk-free, secured rate based on up to CAN$20bn of transactions each day.
- Derivatives trading sees more notional traded in OIS markets (53%), meaning that Risk Free Rates are already a popular choice among Canadian market participants.
If there were improvements to be made, I would simply highlight that;
- IRS trades versus 3 month CDOR. This represents a dislocation to the underlying BAs market that sees 90% of volume in the 1 month and under tenor. Should activity be shifted to the 1 month index for those market participants preferring a term rate?
- OIS markets, despite their notional size, remain predominantly a short-dated market. We can see this when we look at the DV01 of OIS traded from SDRView:
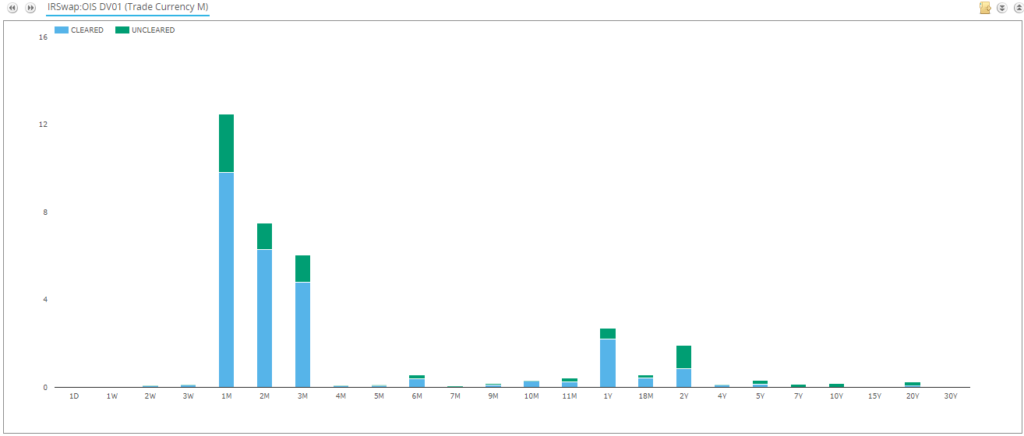
DV01 traded in CAD OIS in the past year from SDRView
Showing a distinctly different maturity profile to CAD IRS. There is almost no activity beyond 2 years and 1 month tenors are by far the most actively traded in CAD OIS.
Hopefully this synopsis of Canadian markets serves to redress the previous lack of content on this blog for Canadian markets.
If there are any other markets you would like to see a summary of, please feel free to ask in the comments below.