Following on from my article on Portfolio Cross-Margining of Swaps and Futures, I wanted to take a more detailed look into the Initial Margin of Interest Rate Futures.
In this article I will compare SPAN with Historical Simulation and check whether SPAN margin is always lower than HistSim margin, which is what we would expect given the different assumptions of the two methodologies.
Example Portfolios
Lets start by creating three client portfolios as follows:
- B9/Acct-EDJun – Long 1,000 Jun 2015 CME Eurodollar contracts
- B9/Acct-5YTreas – Long 1,000 June 2015 5Y T-Note contracts
- B9/Acct-5ySwap – Long 1,000 June 2015 5Y Deliverable Swap Future
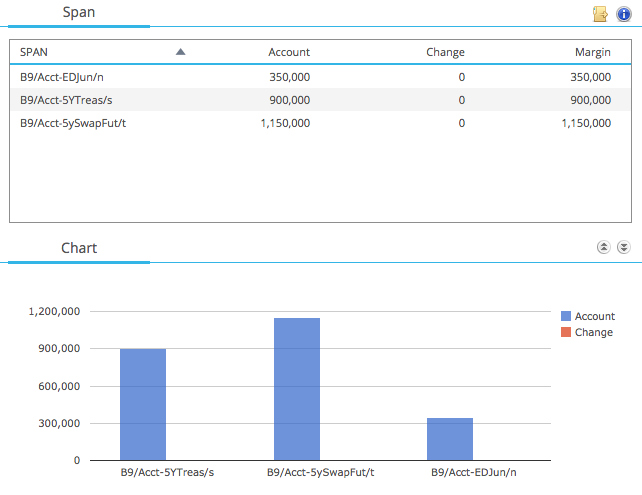
Using CHARM we can run CME SPAN margin for these:
And then CME Historical Simulation margin:
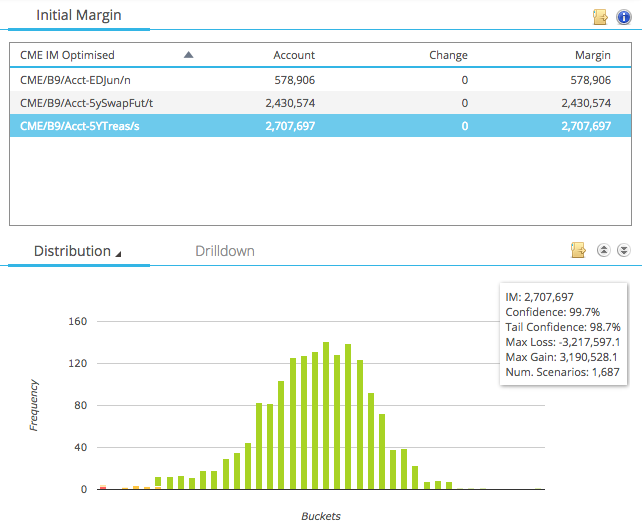
Combining the results into a single table we get:

Showing that:
- SPAN margin is always less than HistSim
- For EuroDollar HistSim is 1.65 times SPAN
- For 5Y T-Note HistSim is 3 times SPAN
- For 5Y Swap Fut HistSim is 2.11 times SPAN
- SPAN is highest for the 5Y Swap Fut
- HistSim is highest for the 5Y T-Note
This is mostly as we would expect. HistSim margin should be higher as it is determined by 5-day price moves using a 99.7% confidence level and a look back period of 6.75 years, while SPAN uses either 1 or 2-day price moves, a 99% confidence level and not sure on the look back period.
What is surprising is why the 5Y T-Note has the highest HistSim margin but the 5Y Swap Fut has the highest SPAN. The only clue we have is that the HistSim P&L vector for the 5Y T-Note (shown below) has larger magnitude losses than the 5Y Swap Fut.
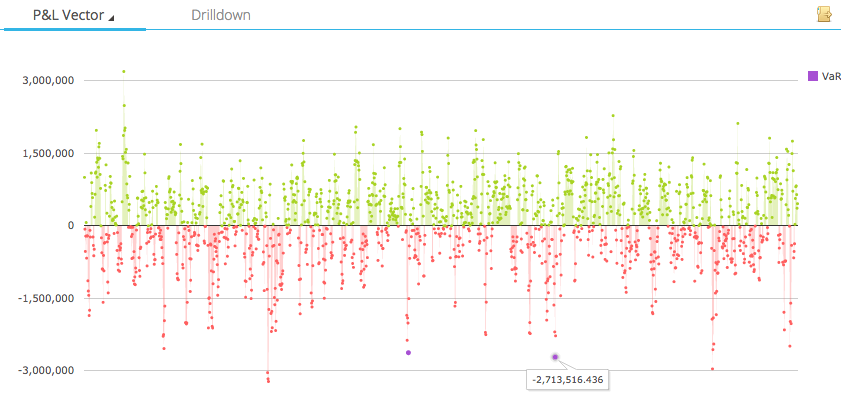
Leaving that aside, so far so good in our quick test of the assumption that SPAN margin is lower than HisSim.
Add in the fact that HistSim for our portfolios varies between 1.65 to 3.0 times the SPAN margin, it would seem unlikely that SPAN margin could be higher.
SPAN vs HistSim Aggregation
How can we go about testing this assumption? Well brute force informed by some simple constraints is often the lazy way. In this case focusing on the aggregation of margin between contracts, as we know that is a methodology difference between SPAN and HistSim.
HistSim recognises the historical correlations that are present in the 6.75 years of time-series data and gives full diversification benefit for these. So for example if we are long June ED and short Sep ED, we would expect the 5-day prices moves of these to be in the same direction most of the time and so our position would gain from this diversification. Similar but weaker correlations can be observed between ED, 5Y T-Note or 5y Swap Fut. (For a refresher on HistSim, see my Workshop Presentation).
SPAN also recognises correlations but aggregates very differently. It uses Intra Spreads between different months of the same contract (so Jun and Sep ED) to increase the margin as Scan Risk would be zero for long vs short in the same number of contracts between consecutive deliverable months. It also uses Inter Spreads between different contracts to decrease the margin. Both of these Spreads are specific to types of Strategies (e.g. Spreads, ButterFlys) and SPAN specifies lots and lots of look-up spread amounts per contract combinations.
(If this jargon filled blurb has lost you, please bear with me as the examples below will clarify)
CME ED Intra Spreads are here and CME ED Inters are here. Given the hundreds of rows in these tables, it seems a reasonable guess that we would expect to see different aggregation behaviour.
More Portfolios
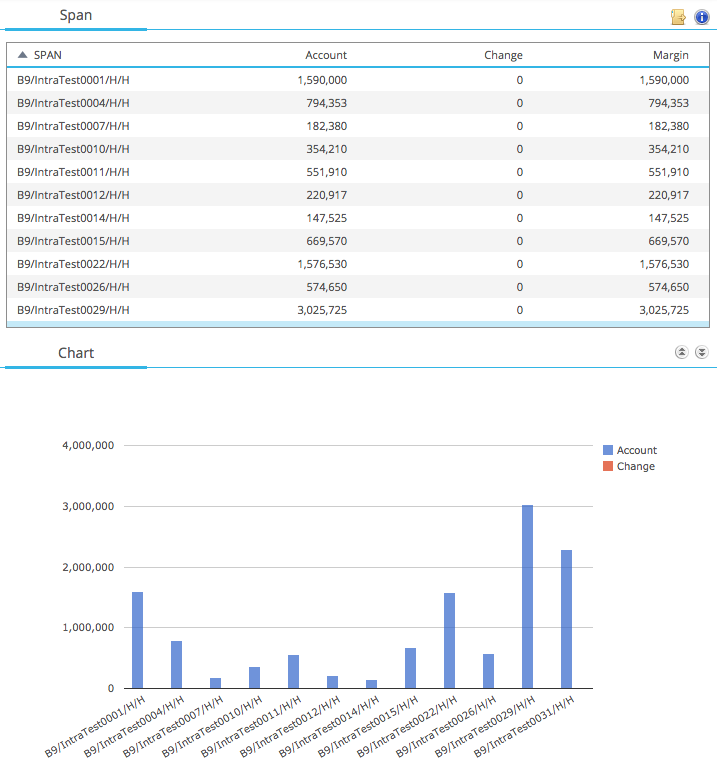
Lets test just the Intra Spreads by creating portfolios that have different combinations of Eurodollar positions. (I created thirty accounts but am only showing eleven of these for illustrative purposes).
Using CHARM we can run CME SPAN margin for these:
And then CME Historical Simulation margin:
Combining the results into a single table we get:
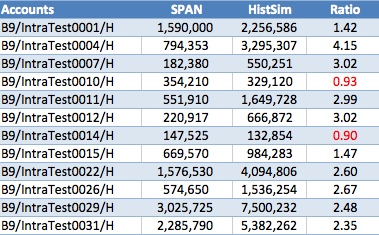
Showing that:
- For most accounts SPAN is less than HistSim
- For these HistSim is between 1.4 to 4.15 times larger
- However there are two accounts where HistSim is less
- The Ratio is 0.9, so HistSim is 90% of SPAN
- Not massive but certainly significant
Lets look in detail at one these these accounts; IntraTest0010.
This has the following positions in ED:
- Dec 2016 (Z16) +805
- Mar 2017 (H17) -1700
- Sep 2018 (U18) +1617
- Dec 2019 (Z19) -790
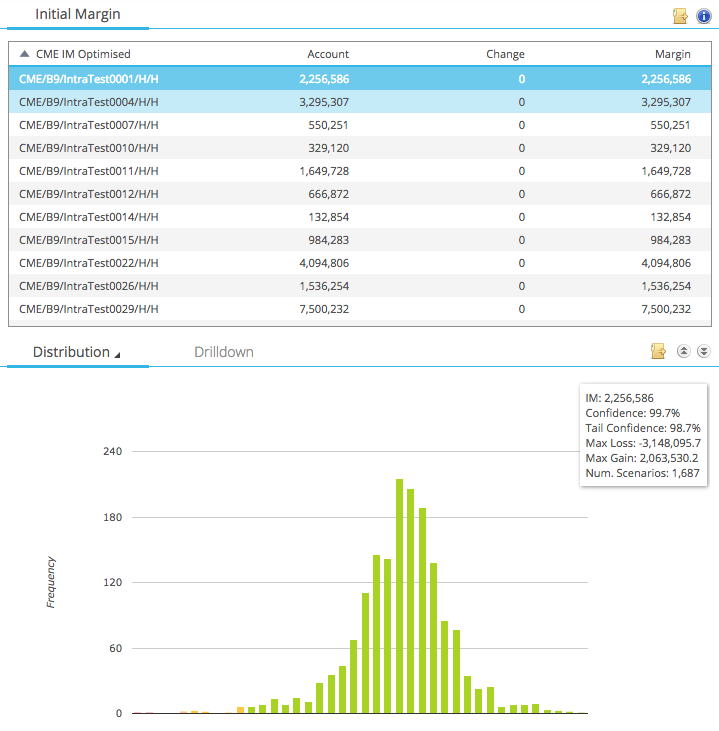
Looking at the HistSim drill-down we see:
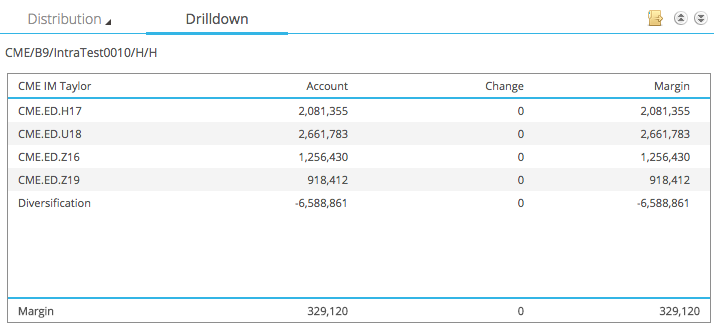
Which shows the IM attributed to each position and the large diversification between them, resulting in a lower portfolio margin of $329,120. This is as we would expect as each of the positions will act to offset the risk in another but are not perfectly correlated in amount or tenor. So in effect we use the actual historical correlation observed in our 6.75Y time period.
Then the SPAN drill–down:
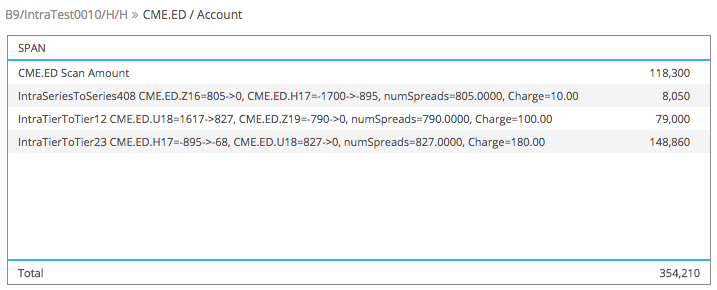
Which shows the:
- A Scan Amount of $118,300 for all of the ED positions
- This assume perfect price correlation between the 4 positions
- (Comparing to the HistSim, we see that the ratio is 2.8)
- Then each of the Intra Spreads formed between the positions
- Which increase the margin as futures prices do not correlate exactly across contract months
- The three Intra Spreads formed increase the margin by $8k, $79k, $149k
- Resulting in a SPAN margin of $354,210
Comparing the two we would say that in this case SPAN penalises this account for imperfect correlations in futures prices in different months of ED more than HistSim which uses the historical correlations observed on 5d moves over the past 6.75 years. Now I don’t know what period SPAN uses to calibrate its Intra-Spreads, but be that as it may, when it comes to correlation there are only weak assumptions.
Now we could repeat the same exercise but with accounts constructed with Inter-Spreads, so containing positions in more than just Eurodollar and I am sure we would see similar sorts of results. However that is a task for another day.
Summary
We compare SPAN margin with HistSim Margin for CME IR Futures.
To test the assumption that SPAN is always lower than HistSim.
Which we would expect given that HistSim is determined from 5 day price moves and SPAN from 1 or 2 day.
We find that this statement is generally true.
Usually HistSim margin is a multiple of SPAN, in the range of 1.5 to 4.
However this is not always true for portfolios.
In certain cases HistSm may be lower. (In our examples 90% of SPAN)
This is due to the differences in aggregation across futures positions.
HistSim uses observed historical correlation to give diversification benefit between positions.
SPAN publishes Intra and Inter Spreads for imperfect correlations.
In the majority of cases these still result in SPAN margin being much lower than HistSim.
However as we have seen there are cases where it is not.
A most surprising result.
Thats all for today.
Thanks Amir. Interesting.
I’m curious whether your tools enable you to compare futures IM between SPAN and HistSim re-calibrated with 1- or 2-day MPOR? You could do this properly by rerunning based on 1- or 2-day moves or at worst approximate by dividing your futures HistSim results by SQRT(5) or SQRT(2.5).
Best
J