- Canadian Derivatives public dissemination of transactions is now in effect
- We can see transactions starting from Jan 16, 2017
- Published with a 48 hour delay from execution time
- Covering Interest Rate, Credit and Equity Derivatives
- Similar in content to US CFTC public dissemination
- Clarus SDRView now includes this Canadian data
Background
Following on from my blog on Canadian Derivatives Reporting to SDRs, I wanted to look at where we are with the public dissemination of transaction data and what this data shows.
In that original blog from April 20, 2015, I noted that public dissemination of transaction data would start on April 30, 2015, which I then updated to July 29, 2016 and finally updated to Jan 16, 2017 as the rules on implementation were updated.
Well better later than never, we now have public dissemination of transaction level data in Canada. The first jurisdiction to do so after the United States in early 2013. We can only hope that other jurisdictions will follow, instead of their existing periodic aggregate data reports, which are of questionable value at best.
There was one caveat that I noted in the original blog, the fact that transactions were to be made public on a T+1 business or a T+2 business day basis, depending on Dealer or Non-Dealer parties. (more on this below).
Lets look at how the public dissemination works.
Canadian GTRs
There appear to be three Trade Repositories approved for Canada. These include ICE Trade Vault CA, CME CTR, and DTCC GTR.
The DTCC GTR seem to have most of the Canadian data, so its best to focus here. The two informational pages are the weekly Canada Public Reports, and more importantly the Public Price Dissemination page. This is very similar to DTCC US Dashboard and in-fact provides a tab for what is now called the CFTC Real-Time Dissemination Dashboard and the new Canadian PPD Dashboard.
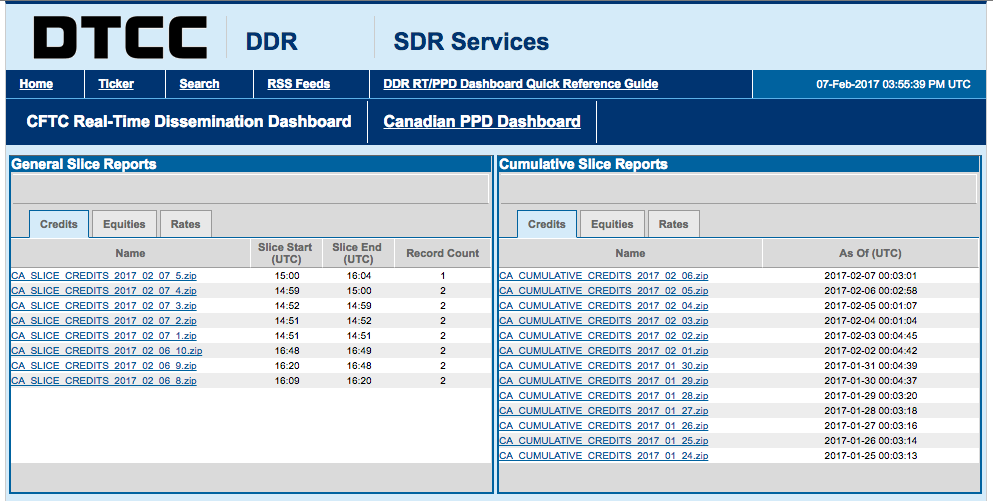
Showing both the intra-day Slice Reports for Credit, Equities, Rates and the daily Cumulative Reports for the same three asset classes.
Not sure why Commodities and Forex are not here, I thought they would be as the weekly public reports show aggregate new transaction counts in both of these asset classes.
Canadian Regulation
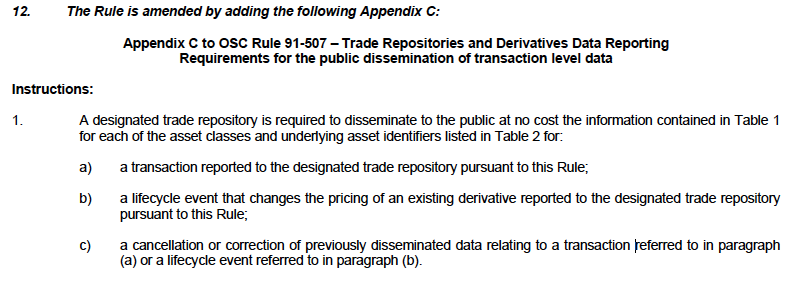
The relevant document for us to refer to is the Amendment to Ontario Securities Commission Rule 91-507 Trade Repositories and Derivatives Data Reporting, available here.
This document specifies the minimum data fields required to be reported to a designated trade repository, which looks similar to the CFTC requirements, but I won’t reproduce that table here.
Of direct relevant to this article is the public dissemination information, which starts with the following.
And then the information itself.
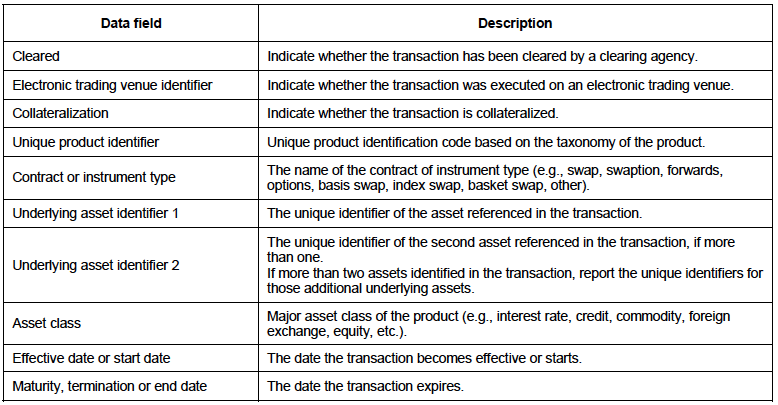
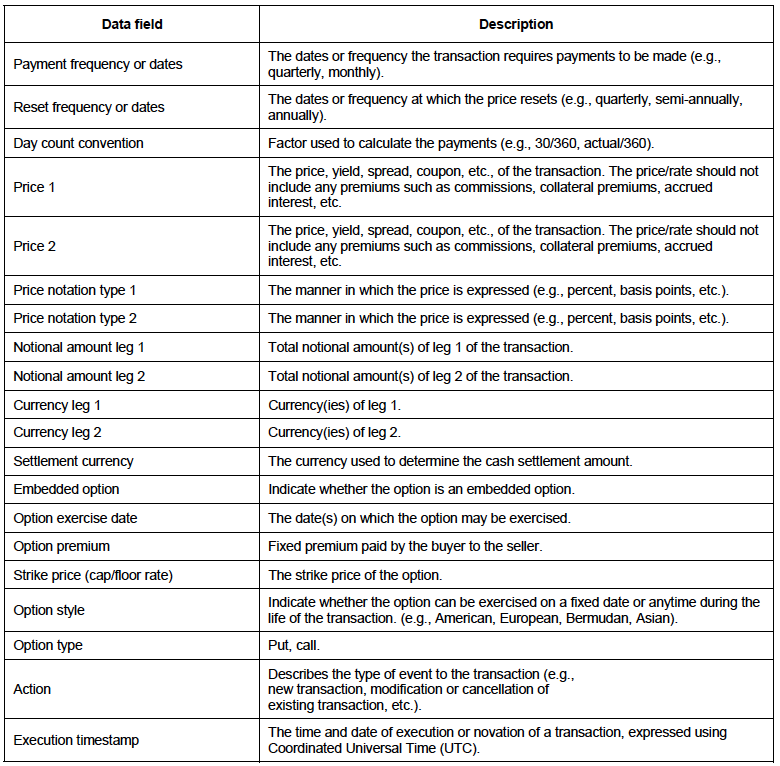
Again very similar to the US CFTC fields, which is good to see.
And then:
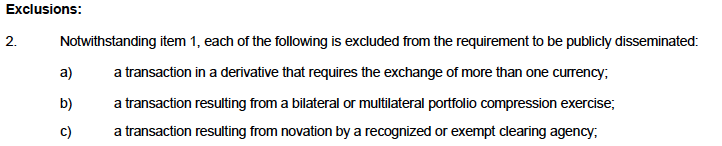
Well 2a) explains why there is no FX asset class available, but it is odd to carve this out. (If anyone knows the reason, please add a comment or email us).
Moving on.
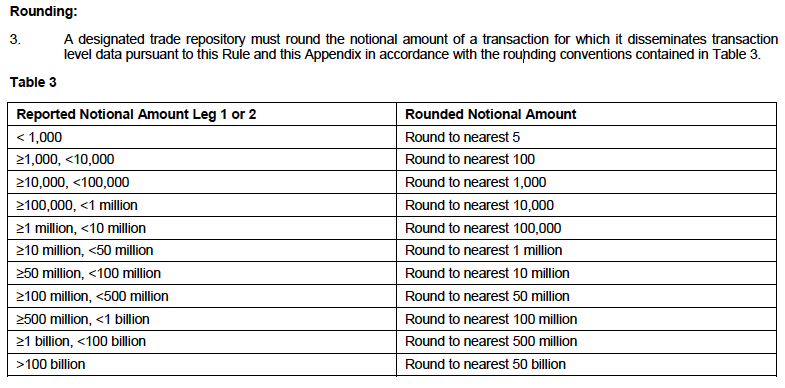
And then the capping rules, which are different to the CFTC ones.
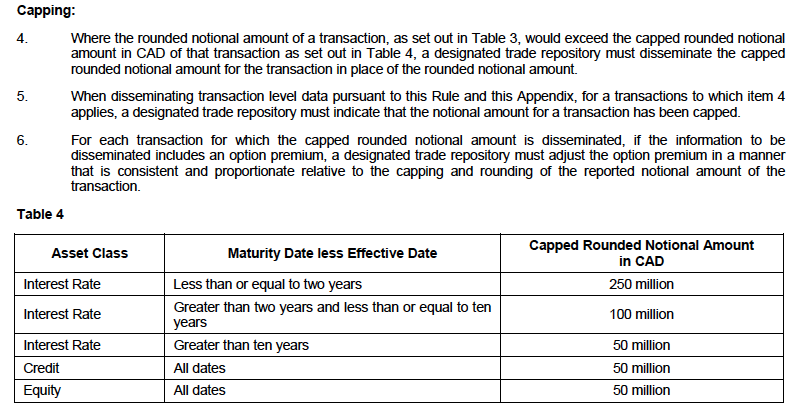
I did think in my original blog that there was a possibility that trades would not be capped given the delayed disclosure and that would have been helpful as we would then know the true notional of large trades; unfortunately that is not the case.
And a final note from the OSC document.

So there you have it, a 48 hours delayed publicly disseminated.
SDRView and Interest Rates
Lets now look at some actual data, using Clarus SDRView.
Starting with CAD Interest Rate Swaps and comparing trade counts between DTCC_CA (Canada) and DTCC (US).
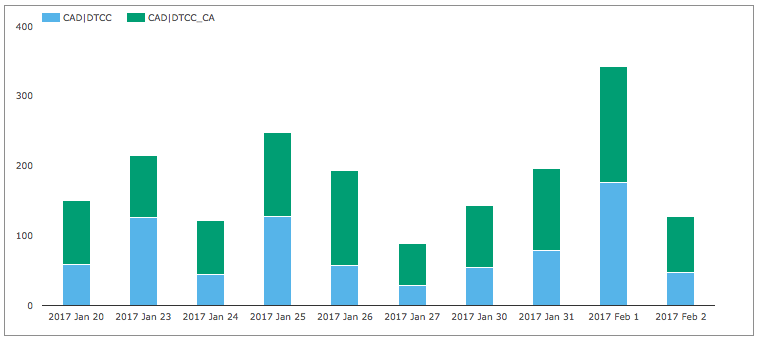
Showing:
- Trade counts for each of the most recent 10 business days
- DTCC_CA counts higher, averaging 100 trades a day
- DTCC (US) averaging 80 trades a day
However given that the Canadian rules have much lower capped amounts than US rules, we would expect a very different chart when looking at gross notional.
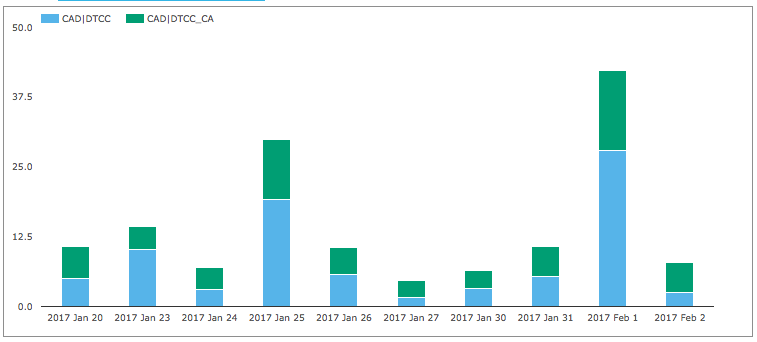
Showing DTCC_CA averaging $8 billion vs $11 billion at DTCC (US).
Now a key question that comes to mind is are there any trades that are in both datasets?
That is, if a US firm trades with a CA firm, will the trade be reported to both US and CA repositories.
Of course, we expect the answer to be yes, as if that were not the case, then one regulator (e.g. OSC) would have to ask CFTC to give it missing Canadian trades, not ideal.
This does however mean, we cannot simply aggregate the trades in DTCC (US) and DTCC_CA, again not ideal.
How big is this problem?
Lets look at the data for one day, Jan 25, 2017, where DTCC_CA has 121 trades and DTCC (US) has 127 trades.
Lining these trades up by timestamp and comparing other fields we find at least 13 trades that are the same.
(Note I have not compared the US BBG SDR with DTCC CA, which might throw up a few more).
In-fact as a check on data quality of the Canadian dissemination, lets compare the fields for these 13 trades.
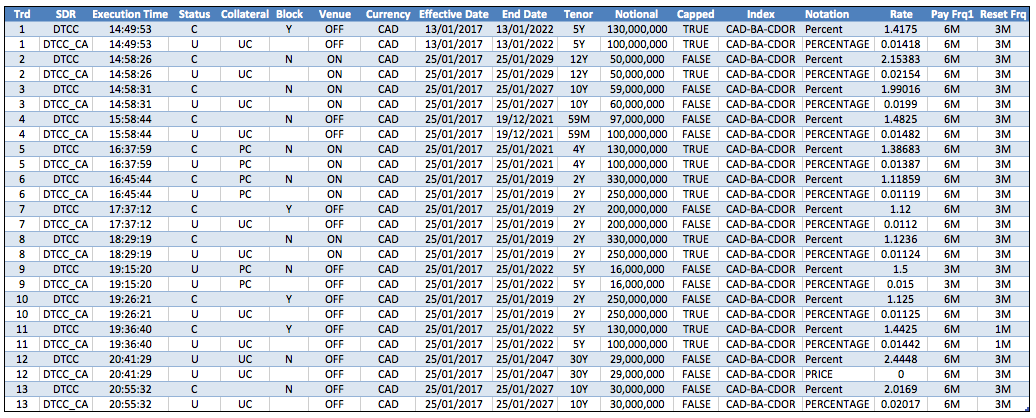
Showing:
- Pairs of trades that are the same (as execution time and other key fields match)
- Status field is meant to signify Cleared or Uncleared
- Unfortunately this does not seem to be populated correctly as every CA trade has U for Uncleared
- For Uncleared trades the CA Collateral field does agree, showing PC or UC (Partial or Un-Collaterised)
- Block is not populated (as not one of the required Table 1 fields)
- Notional shows the different capped amounts (e.g. first Trade)
- Rate is not a percentage as the notation says but a decimal (surely this should have been fixed by now!)
- Other fields agree exactly (e.g. Venue, Dates, Frequency).
So while some improvement in quality is needed, the data is generally useful.
Before we leave Interest Rate Swaps, lets look at a comparison of USD Swap trade counts.
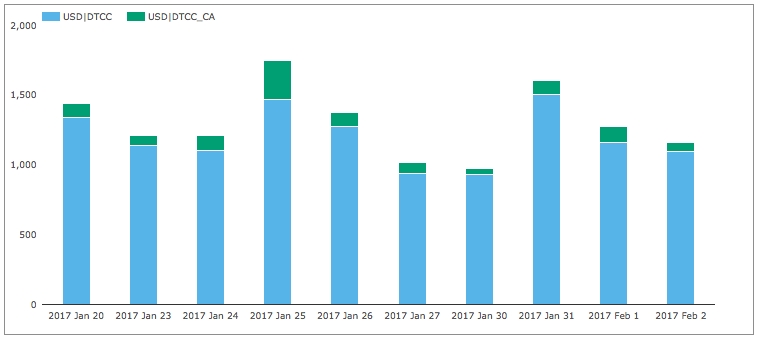
Showing that DTCC_CA averaging 105 trades a day, compared to the 1,200 at DTCC (US).
And a last chart before we end, CAD IR Swaptions trade counts.
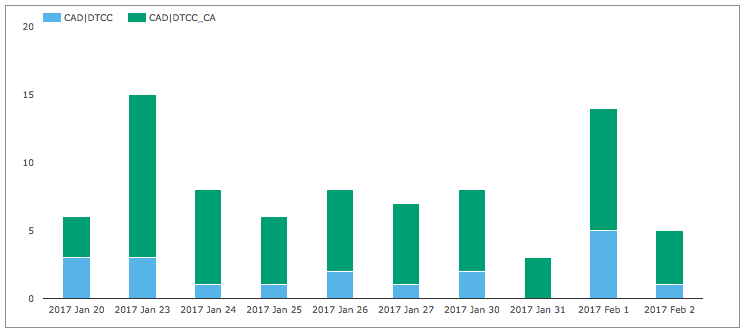
A daily average of 6 trades at DTCC_CA, not a lot, but certainly more than the 1 or 2 a day in DTCC (US), which for an important product like Swaptions is very useful indeed.
There are other Interest Rates and Credit products, but I will leave that for you to check yourself in SDRView.
Thank you for reading to the end.
I plan to look at other aspects of Canadian data in a future blog.