- Our Clarus Daily Briefing is *FREE*.
- It provides a summary of price moves, volume trends and central bank expectations.
- Bringing you information about Swap markets straight to your inbox.
- Is your firm interested in sponsoring the Daily Briefing? If so, reach out to us.
The FREE Clarus Daily Briefing
Every morning, Clarus deliver our Daily Briefing to the inboxes of our subscribers:
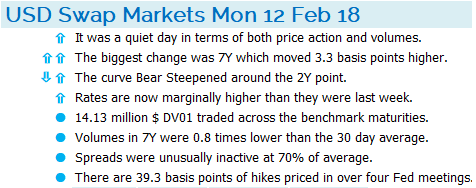
USD Daily Briefing 12 Feb 2018
It takes less than two minutes each morning to read, digest and get on top of what’s happened.
Here’s a run-down of each section. And you can subscribe here for *FREE*.
Summary
Each bullet point covers something unique about the previous day:
- What happened?
- Where were the biggest price moves.
- What did the Swap curve do – steepen, flatten, twist?
- Some perspective – how have rates moved relative to last week, last month?
- We measure volumes in DV01s (not meaningless notional amounts).
- We compare volumes to 30 day averages.
- We compare volumes in Spreadovers (swaps traded versus a US Treasury bond) to their average amounts.
- Finally, what is the Fed up to? OIS prices are analysed to look at what is “priced in” for future Fed meetings.
- Subscribe now.
Prices
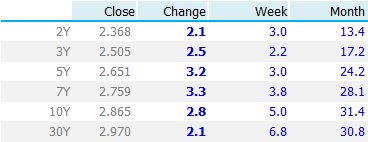
In the interests of transparency, we also provide the raw data. First off, we look at Swap Rates, and compare these to yesterday, last week and last month:
 Showing;
- The Tenor of the swap rate (benchmark tenors 2y,3y,5y,7y, 10y and 30y).
- The actual swap rate (e.g. 2.865% in 10 years).
- The change, in basis points, from yesterday to today. For example, the 10y Swap Rate is 2.8 basis points higher today, meaning that yesterday it was down at 2.837%.
- The change, in basis points, from last week (5 trading days ago).
- The change, in basis points, from last month (so thirty days ago, 10y swap rates were all the way down at 2.551%).
Swap Curve
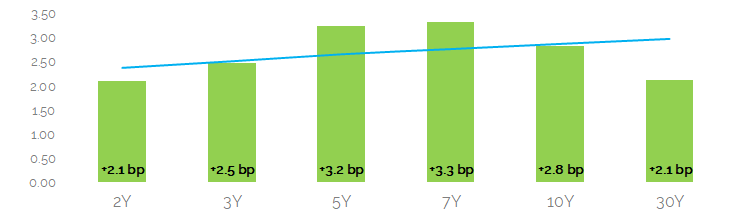
We provide the same data but in graphical form, by way of our Swap Curve:
 Showing;
- The blue line is the Swap Curve. It plots the Swap Rate at each tenor of the curve.
- At each tenor, we show the change on day of that Swap Rate.
- Just as we said, 10y current Swap Rates are at 2.865%. These are +2.8bp higher than they were yesterday (2.837%).
Volumes
We consider the Clarus Daily Briefing as unique because we devote a lot of attention to the volumes behind the price moves. We believe that volumes tell at least half of the story when considering where and how prices have moved. Subscribe now to make sure you get this volume information daily.
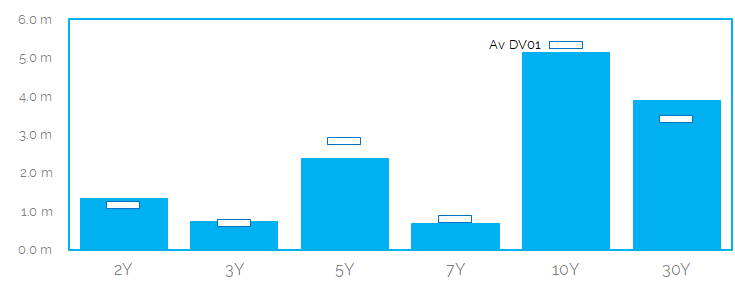 Our Volume chart shows:
- The volume, in millions of USD DV01, that traded yesterday in each of the six major tenors. These are the large blue bars.
- We also show the average DV01 that traded in each tenor in the past 30 days. These are the white boxes.
- Adding historic perspective to current volumes allows readers to quickly interpret how active trading was.
- Generally, a large price move on large volumes is likely to be persistent. A large move in price, but on thin volumes, is far more likely to reverse.
We also provide this information in a table:
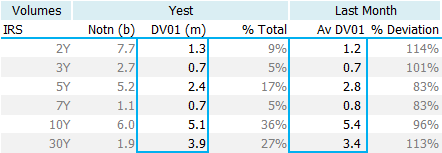
Showing:
- The tenor of the swap.
- The Notional amount in USD billions. This is our single nod to the “Bloomberg headline” law that states you must include meaninglessly large numbers when writing about the swap market. Because apparently everybody loves a large number.
- The DV01 that traded. This is a meaningful measure of market activity. It measures the valuation difference of a swap for a given change in the underlying price of the swap. $1m DV01 of 2 year risk is exactly the same amount of risk as $1m DV01 of a 10 year swap. It means that if the swap rate moves by 1 basis point (0.01%), the value of swaps traded in that tenor will change by $1m.
- The maturity profile expressed as the percentage of risk traded in each tenor. So in this case, $5.1m DV01 in 10 years is 36% of the total $14.1m DV01 that traded across the entire curve.
- We also show the average DV01 that traded in the prior 30 days. In 10 year swaps, an average day saw $5.4m DV01 of risk traded.
- We compare this historic average to current volumes. We can see that 5y and 7y tenors only traded 83% of their historic averages. Where-as for 3 years, $3.9m DV01 traded which is 113% of the $3.4m historic average.
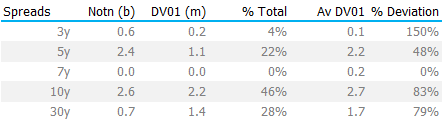
Spreadovers
We include an analysis of package trades that transacted versus US Treasuries. These are an exceptionally liquid portion of the US Swaps market, particularly in the D2D community.
 Showing;
- The tenor of the spreadover. A 5y spreadover consists of a spot starting 5y Interest Rate Swap versus the closest (current) on the run 5 year US Treasury cash bond. The Spreadover is expressed as the fixed rate of the swap minus the yield to maturity of the bond.
- The Notional amount that traded. (Our final nod to a headline number).
- The DV01 that traded.
- The maturity profile expressed as the percentage of risk traded in each tenor.
- We then show the historic averages.
- And compare the historic averages to current volumes.
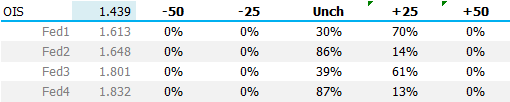
Central Bank Expectations
What will the Fed do with Interest Rates? It is a natural question for all market professionals.
Our *FREE* Daily Briefing tells you. Subscribe now.
Showing;
- We start with the current level of Fed Funds. In this case, 1.439%.
- We then use SDR prices to interpret where each OIS swap is that starts on the day after the next Fed Meeting, and ends on the date of the following Fed Meeting (so-called FOMC-dated OIS swaps).
- The next Fed meeting (“Fed1” in the table) currently has an implied rate of 1.613%.
- We therefore believe that for this meeting, there are (1.613% – 1.439%) = 17.4 basis points of hikes priced in.
- Assuming that the Fed only moves in 25 basis point increments, this means that we see a 17.4/25 = 70% chance of a rate hike at the next meeting.
- We repeat the process for the next Fed meeting. There, we have an implied market rate of 1.648% versus the previous meeting at 1.613%. This is only a difference of 3.5 basis points. 3.5/25 = 14% chance of another 25 basis point move (and by extension an 86% chance of unchanged).
Each of the calculations for this table is performed in isolation. The table does not explicitly state what the chances are of consecutive 25 basis point hikes at the next two meetings. To calculate that, we would have to take a 70% chance of a hike PLUS a 14% chance of another hike immediately afterwards.
Of course, we could get to different levels of rates across a number of paths. To see a 25 basis point hike in two meetings time, we could witness a 50 basis point hike followed by a 25 basis point cut.
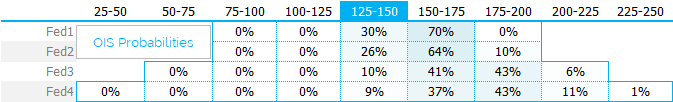
We try to give an idea of these path dependent options with our probability tree:
Showing:
- The probability at each of the next four Fed meetings of Rates being within a given band of rates.
- Currently, Fed rates are within the target band of 1.25% – 1.50% (125-150 in our nomenclature above). Recall that the previous fixing was 1.439%.
- At the next meeting, there is just a 30% chance that rates are left unchanged. Far more likely, there is a 70% chance that rates are hiked into the 1.50-1.75% target range.
- At the next meeting, there is a 10% chance (70% * 14%) that rates are hiked twice in succession and we end up in the 1.75-2.00% target range.
- However, there is also a chance that rates are unchanged at both meetings. This is equal to (30% * 86%) = 26%.
- The central scenario is for a rate hike next month followed by unchanged (70% * 86%). But this can also be achieved by unchanged followed by a hike (30% * 14%). Overall, the 64% probability is achieved via both paths (70% * 86%) + (30% * 14%) = 64%!
- Just don’t ask how many paths I have to model to get to the bottom line! Just be happy that we do it so that you don’t have to…..
MIFID II
One day, MIFID Data will be good enough to expand these reports beyond the confines of a single jurisdiction. These Daily Briefings will cover global swap markets. But we need to overcome the ISIN debacle and the unavailability of MIFID II public data first. Watch this space. And in the meantime: