- The CME Compression run in March coincided with a peak in daily volumes for 30 year USD Swaps.
- Amongst falling Average Daily Volumes in USD Swaps over March as a whole, this extra 30 year activity was particularly noticeable.
- We also saw a peak in 30 year CCP Basis trading a day before the CME Compression run.
- We wonder if the three things – CME Compression, 30 year USD Swap activity and 30 year CCP Basis hedging are all related?
An Animated Start
I thought it would be interesting to update a couple of blogs this week, by way of a “replay”. So looping below you is our Tenor View of March 2016 on a day-by-day basis for all USD Swaps. This is something that I’ve been meaning to look at for a while, and we actually first mentioned this concept way back in 2014:
Showing;
- For each trading day, the DV01 traded per tenor and reported to either DTCC (green) or Bloomberg SDRs (blue).
- We can see that 5y, 10y and 30y dominate trading in all sessions, with 2y swaps tending to be the next largest amount of risk traded.
- 10y tends to be the most traded tenor, but during March 2016 we did see some unusual days when 30 years traded more than any other maturity.
- Looping through the days like this offers us a different way to look at our data and to summarise the past trading month – much as we do via our Swaps Review.
Per Maturity
Over the course of March, we saw Average Daily Volumes declining in benchmark swaps. However, as the animation above shows, not all trading days are born equal. Particularly, there are two trading days that jump out for unusually large activity in the 30 year tenor.
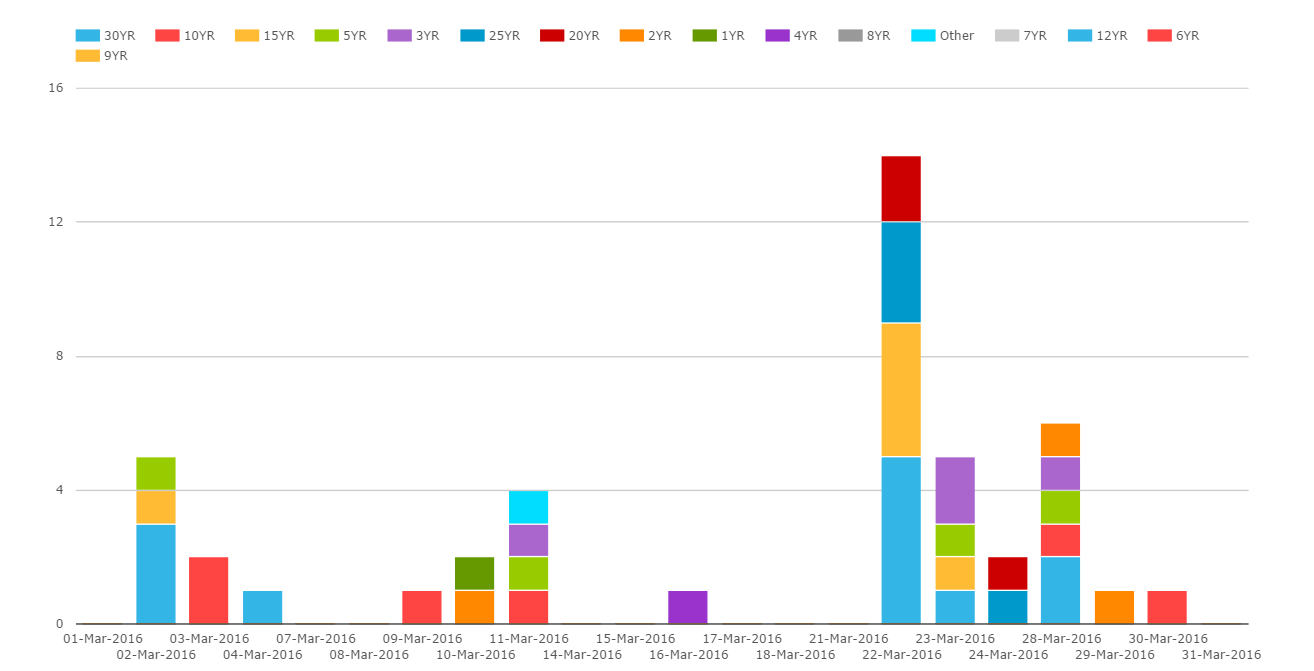
I therefore took a look at average daily volumes for March in more detail. The chart below shows the deviation from the monthly average for each trading day. These deviations are then colour-coded by maturity.
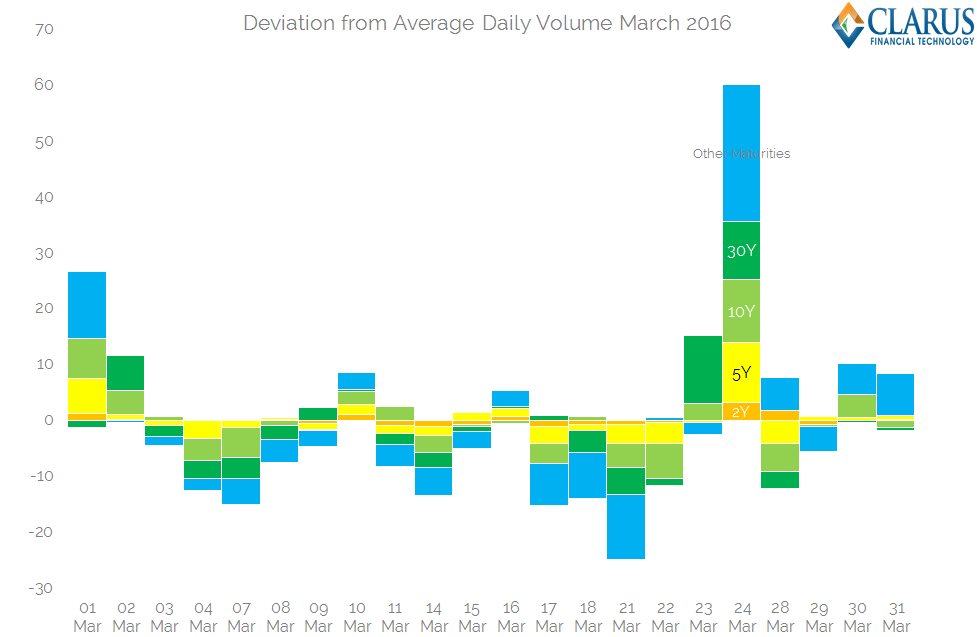
Showing;
- March 23rd and 24th were highly unusual in terms of volumes
- All maturities saw elevated trading….
- ….but these deviations were most pronounced at the long-end, where there was double the normal trading volume in 30 year swaps (dark green bars) on both of these days.
What might explain this long dated volume?
According to the US Treasury website, the 30 year Bond auction isn’t until this coming Thursday (14th April). And I haven’t seen any particular news about large corporate bond issuance in the 30 year sector during late March/early April. So it doesn’t seem to be issuance-led activity.
The data reveals two other possible explanations – CCP Basis and Compression.
Compression in the SDR Data
We can also run our Tenor analysis on trades marked as “Compression” in SDRView. We see that on the 23rd and 24th March, volumes were significant:
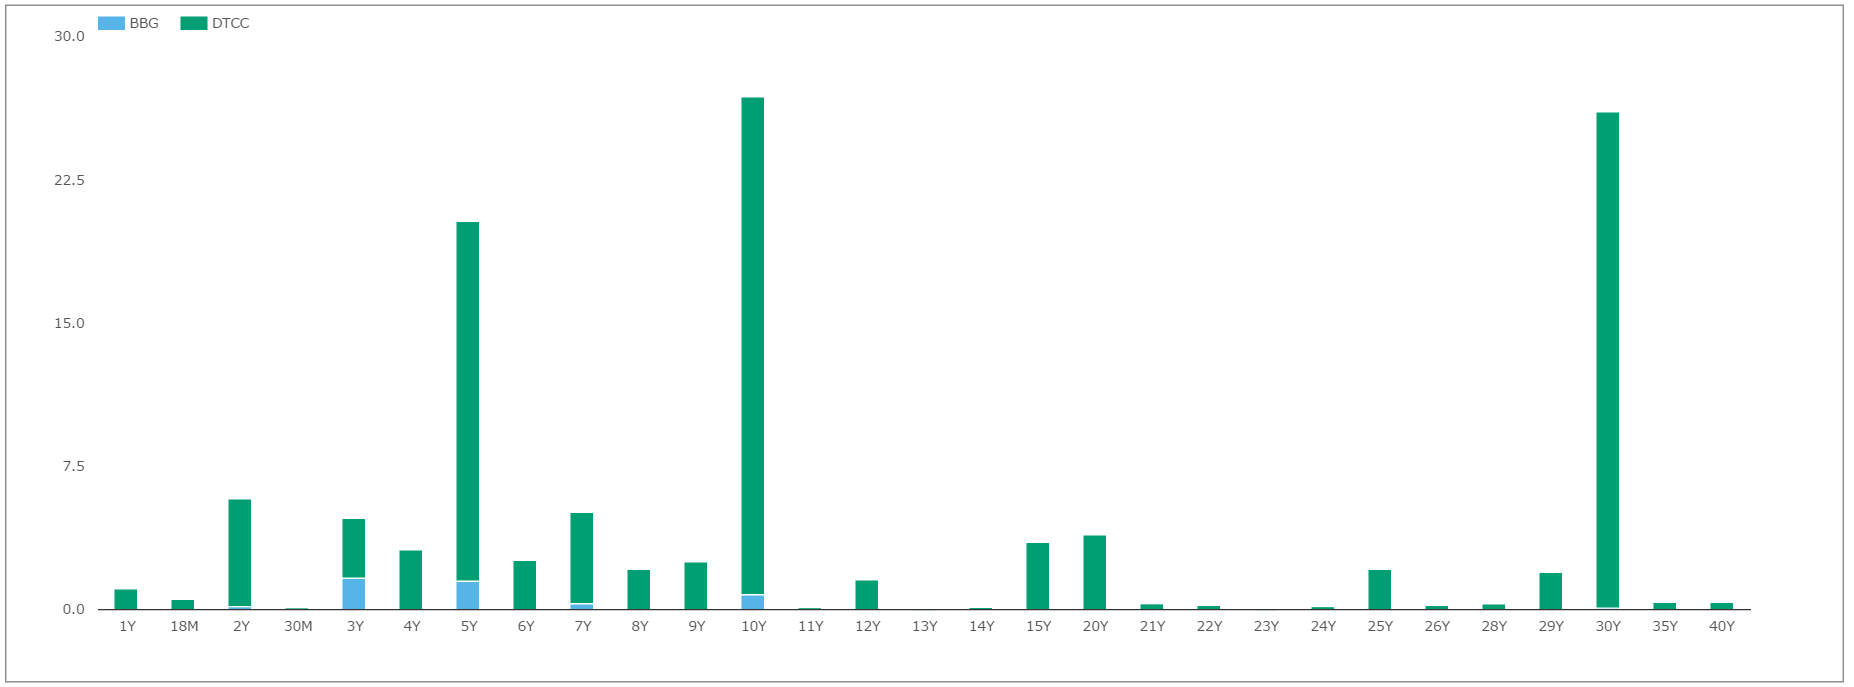
Showing;
- Over $26m in DV01 compressed in both 10y and 30y tenors across these two days
- In terms of overall notional, $230bn was compressed across all maturities.
CCP Basis from SEFView
Looking at our CCP Basis volumes from SEFView from March reveals two more seemingly-related instances of large volumes.
 Firstly, volumes during the month were highest in the 30 year tenor as well (chart to the right).
Maybe even more surprisingly, there was a significant spike in CCP Basis activity on the 22nd March – the day before these large Compression runs. This activity was also focussed in the long-end.
See daily chart below:
Putting these two together, it seems possible that the Compression activity on the 23rd and 24th that was reported to the SDRs was conducted at the CME, with the facilitating dealer hedging the basis in the IDB market. But there could be one other explanation…
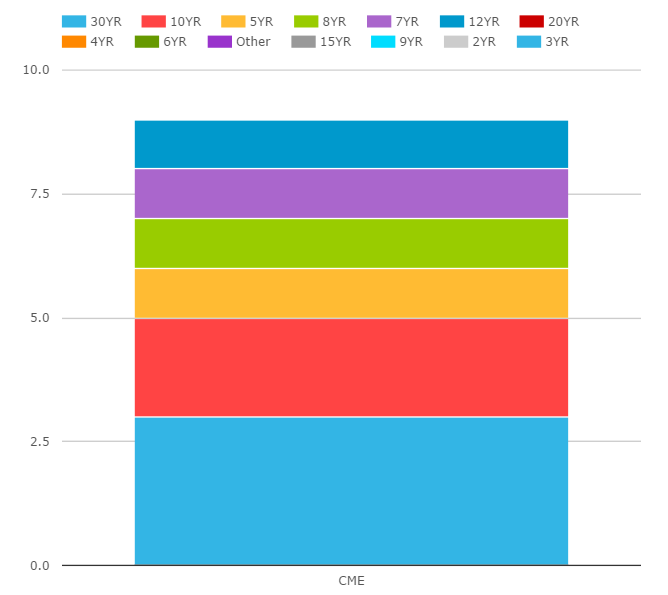
CME Compression of $1.25trn
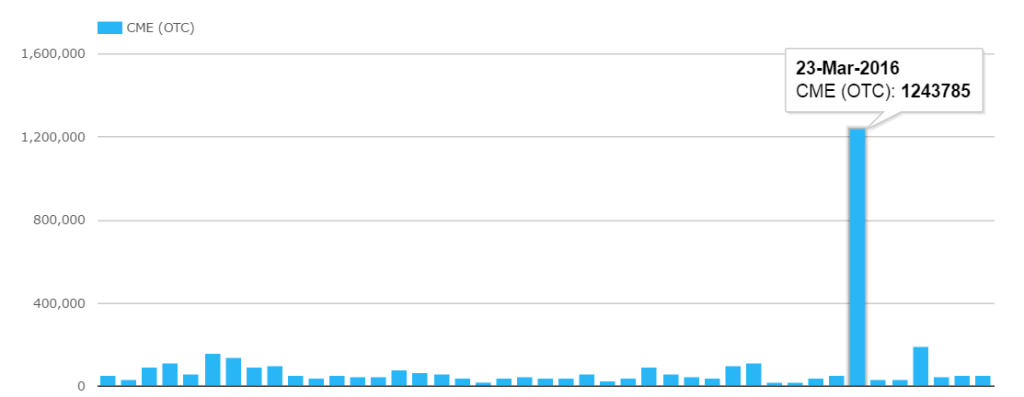
Reading Amir’s March Review again, I noticed that the large CME Compression volumes resulting from the TriOptima run were also done on 23rd March (chart on the right). This was (approximately) $1.25trn, so not the Compression we are seeing in the SDR figures.
I therefore turned to CCPView to have a closer look into the maturity profile of these trades.
CME report their volumes with a Maturity mark-up, meaning that we can calculate the portion of this Compression run that was conducted in longer maturities. Et voilà;
- A total DV01 of $700m plus was compressed
- Of that, $160m was in maturities 20 years and longer – so about 20% of the risk being compressed was long-dated.
- Our spike in 30-year related activity on these days, as seen in the SDR data is big, but it is not $160m in DV01 big! That is huge. So the good thing is that we are not seeing these Compressed trades somehow end up in SDR data.
So the question I’ve asked myself is whether it is a coincidence that we’ve seen so much activity concentrated across 3 days, and all seemingly centred around the long-end? Specifically, I’m wondering whether we’ve seen a portfolio simultaneously compressed at LCH (via e.g. Tradeweb/TrueEx) and CME (via TriOptima) with the facilitating dealer hedging a portion of this in the interdealer CCP Basis market. Ordinarily, the portfolios being compressed should be risk neutral – but maybe we have some leniency creeping into what “risk” is being neutralised here?
Is this possibly a cheaper way to trade the CCP basis?
It sounds plausible to me….and I thought worthy of a blog post at the very least!
In Summary
- We saw a peak in CCP basis hedging on the 22nd of March
- Followed by a CME TriOptima Compression run on the 23rd….
- ….and then some very large volumes on the 23rd and 24th of March in Compression runs reported to the SDR.
- All of these activities had risk concentrated in the 30 year area of the curve.
- It seems they are somehow linked to each other….
- …the evidence from the data certainly suggests so anyway.
- So remember to subscribe for more data-led insights into the swap markets.