- We update our analysis on the new CME Ultra 10 UST Future by looking at volumes in Invoice Spreads with matching dates to the futures contract.
- We find continued impressive volumes.
- About 6% of the risk-weighted volume in futures can be attributed to Swaps-related trades.
The headline numbers
Invoice Spreads versus the CME Ultra 10 UST Future are continuing to trade, as the FT noted in their article yesterday.
We have now seen the first “roll period”, where positions from the March contract may have to be rolled into June and other months. Since our first blog in February, we can see the following trades from SDRView Pro:
- A further 53 trades have occurred versus either the Mach or June Ultra 10 contract.
- A total of 178 trades since the beginning of the year (the contract launch date).
- A total DV01 of $16.6m.
- A total notional of $19.1bn.
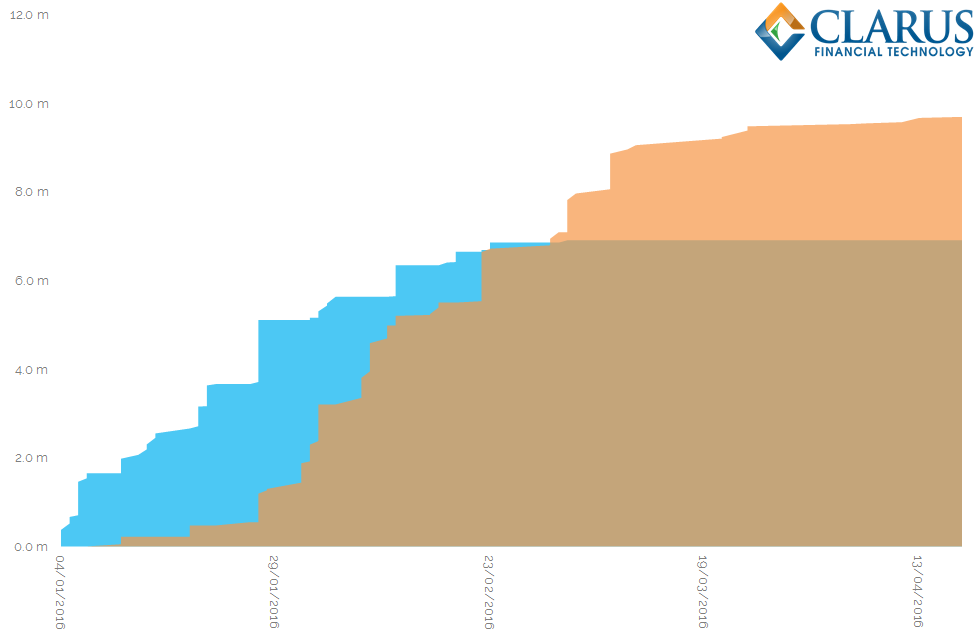
The chart below summarises the Invoice Swaps trading we have seen versus this new contract. It shows the running total DV01 traded in the March contract (blue area) and the June contract (orange area) throughout 2016:
Showing;
- Initial trading activity in January was exclusively in the March contract
- The June contract has seen activity as early as the 11th of January
- Around the beginning of February, trading in the June contract accelerates
- Roll activity from March to June is not immediately obvious.
- Since the beginning of March, trading continued in the June contract at an impressive rate, which has recently tailed off.
The Futures Market
The natural question to ask is how this stacks up against the growth in trading of the futures contract itself? We can run a pretty similar analysis using CME’s Open Interest figures from their website:
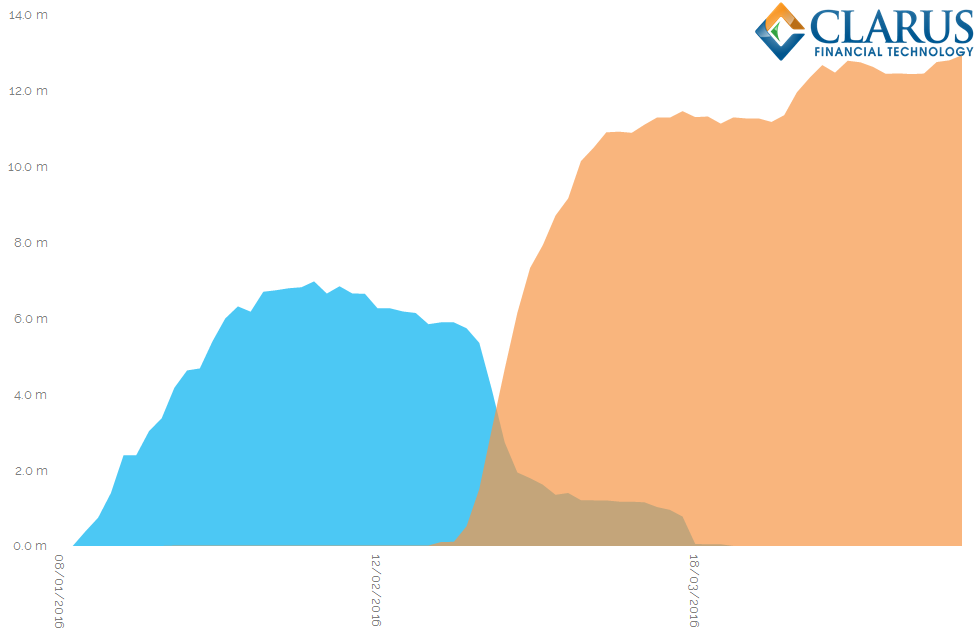
Showing;
- Using the CME Invoice Spread calculator, I have converted the number of contracts of Open Interest into DV01 terms – to make comparisons with Swaps far easier.
- As expected, the Open Interest of the March contract peaks around the middle of February.
- It decreases rapidly in the final week of February (as delivery approaches) until the June contract can be considered “on the run” as of the 25th.
- Importantly, the Open Interest of the June contract is greater than at any point in the March contract, showing continued trading take-up of the new futures contract.
This chart looks different to the swaps chart because we are only considering Open Interest. In Swaps, we do not have such a concept, therefore we can only look at Volumes. Therefore, I thought it would be interesting to look at total volumes traded in Futures versus total volumes traded in Swaps. This should be a like-for-like comparison.
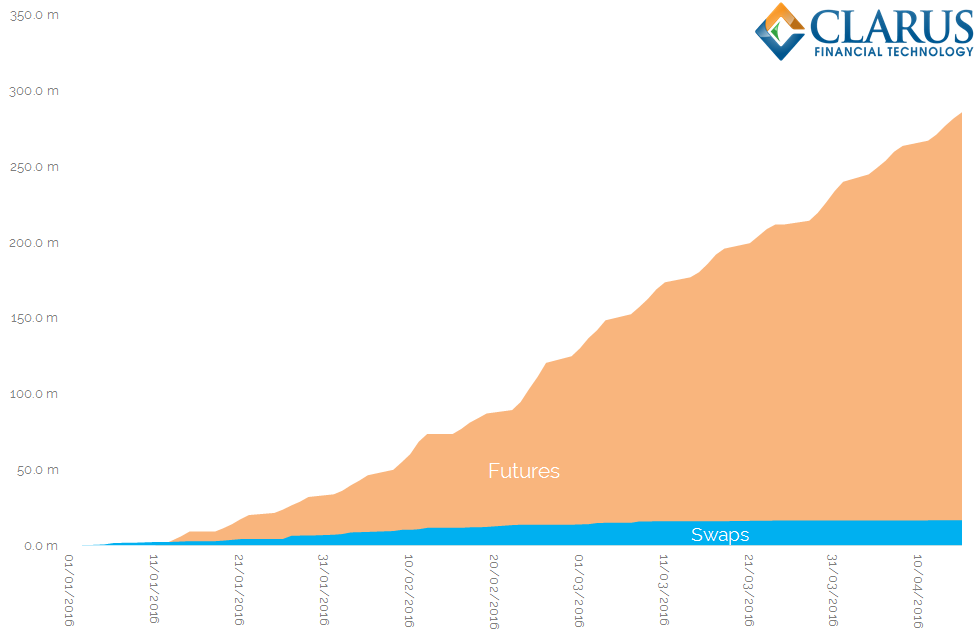
Showing;
- In DV01 amounts, the total traded in Futures (orange area) and swaps (blue area).
- Futures tend to see more “in-and-out” trading hence the total volumes seen are much higher (nearly $300m in DV01!) than the peak Open Interest that we’ve seen. Swaps are generally a lower velocity product, therefore may not see such a large dislocation between total volumes and total open interest.
- Nonetheless, Swaps have traded 5.8% of the total futures risk transacted so far. That is an impressive amount.
- The total amount of Swaps risk traded is $16.6m in DV01.
- From our previous chart, we can see that the net Open Interest stands at $12.9m in DV01 for the June contract.
- Given that the total Swaps risk traded is larger than the Open Interest, it therefore stands that there has been a fair amount of in-and-out trading within the swaps arena during this time – for example rolling positions from March to June contracts.
Average Daily Volumes
To put another perspective on these numbers, it is worth also considering the average daily volumes that are currently trading. Taking a 10-day moving average;
- For the new futures contract, over $4m in DV01 trades per day.
- For swaps, ADV is now around $20k in DV01. We have seen prior periods where this number has been much higher in swaps.
In a newly developing market, these ADV numbers can be fairly volatile. Particularly for swaps, we may have to wait to see new participants beginning to trade this structure. Positions in swaps space also tend to be held for a longer time-period, hence decreasing average daily volumes.
In Summary
- Invoice spreads versus the new CME Ultra 10 UST Future continue to trade.
- Swaps have already traded nearly $17m in DV01 versus this new contract.
- Of the total risk traded, Swaps have accounted for around 6% of the market.
- We will monitor average daily volumes of Invoice Spreads to see whether they continue to be a driver of this fast-growing futures contract.