We last looked at CME-LCH Basis in August 2019 in CME-LCH Basis Narrows to Four Year Low and as there has been significant volatility in the last few months, high time we looked at this again.
Background
For Swaps that are economically the same, it is non-intuitive that the fixed rate should be different depending on which CCP clears the trade. If I am paying Libor 3M every quarter on a trade, I expect to receive the same stream of fixed cash-flows on another trade done at the same time with the same economic terms.
We have covered the reasons for the price difference due to the CCP in a number of blogs (here and here).
In summary these boil down to an asymmetry between payers and receivers at a CCP, requiring dealers to hedge at a different CCP and paying two lots of gross margin; the cost of which they need to recover in the price charged to the customer.
CME-LCH Basis Spreads
Let’s start with daily prices in 2020 so far, for major tenors provided courtesy of ICAP.
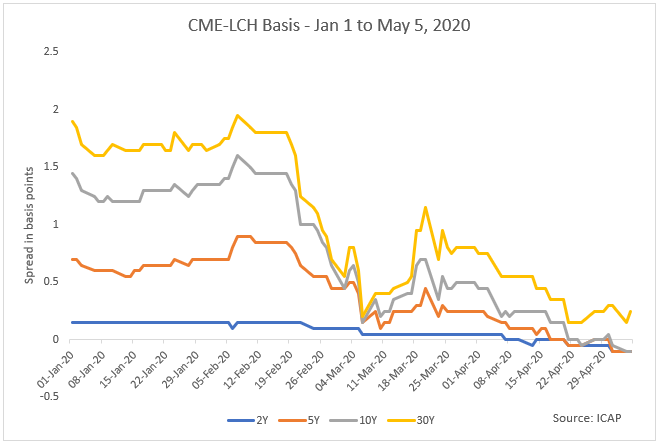
- 30Y starting the year at 1.9bps, falling sharply on 21-Feb to 1.25bps, down to 0.2bps on 6-Mar, back up to 1.15 bps on 20-Mar and then down to 0.15 bps on 4-May.
- 10Y with a similar pattern, so I won’t repeat the roller coaster description.
- 2Y, 5Y, 10Y each now at negative 0.1 bps
We know that Swap Rates themselves dropped significantly starting in late February on expectations of the Federal Reserve rate cuts, which first took place on March 3rd.
Swap Rates
Let’s take a look at these for major tenors, derived from a VWAP of trades done each day.
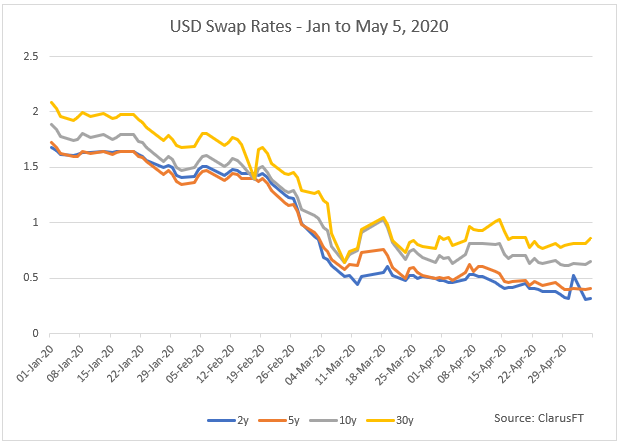
- 30Y starting the year at 2.08%, drifting down with gathering momentum to 1.26% on 2-Mar, then falling sharply to a low of 0.65% on 9-Mar, back up to 1.05% on 19-Mar and then down again to 0.78%, before ending at 0.86% on 5-May
- 10Y, 5Y, 2Y with similar patterns with current values of 0.65%, 0.41% and 0.31%.
Clearly the change in the level of Swap Rates is a reason for the moves we have seen in the CME-LCH Basis Spread, as lower levels of Swap rates will lead to a narrower basis.
However the collapse in the basis has gone well beyond the collapse in Swap rates, meaning that these market moves also caused a significant change in the balance of receivers and payers at CME.
Let’s turn next to Swap volumes.
Cleared Volumes of USD Swaps
Using CCPView lets look at the weekly gross notional in USD IRS at CME compared to client cleared gross notional at LCH SwapClear.
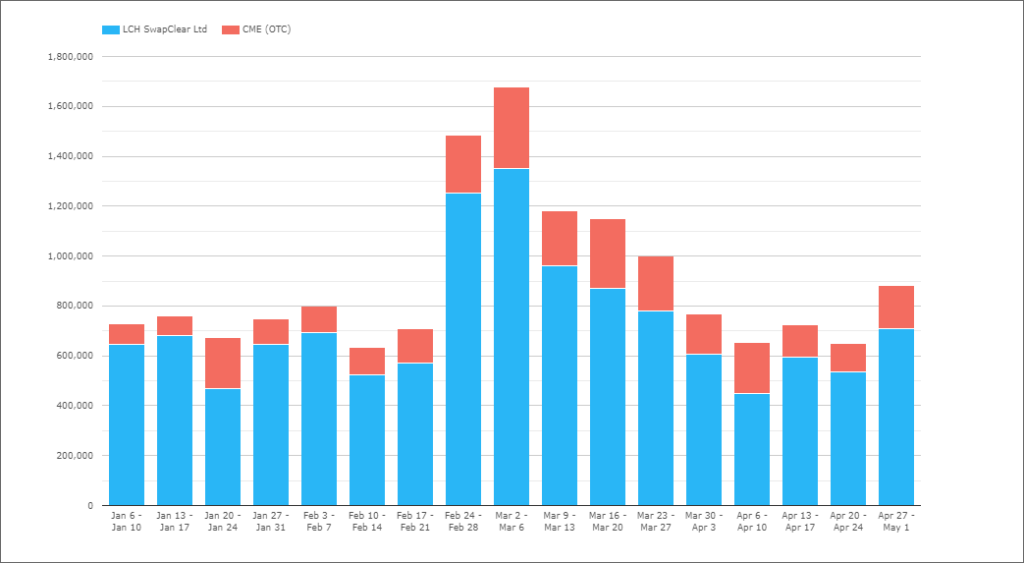
Showing that both CME and LCH volumes in the weeks of February 24th and March 2nd, were over twice the weekly average and remained elevated for most of March.
The share of CME volume compared to LCH client clearing is 20% to 80% year to date in 2020, with CME ranging from 10.5% in the week of January 13th, to a high of 31% in the weeks of January 20th and April 6th.
Changing this chart to monthly and percent of total.
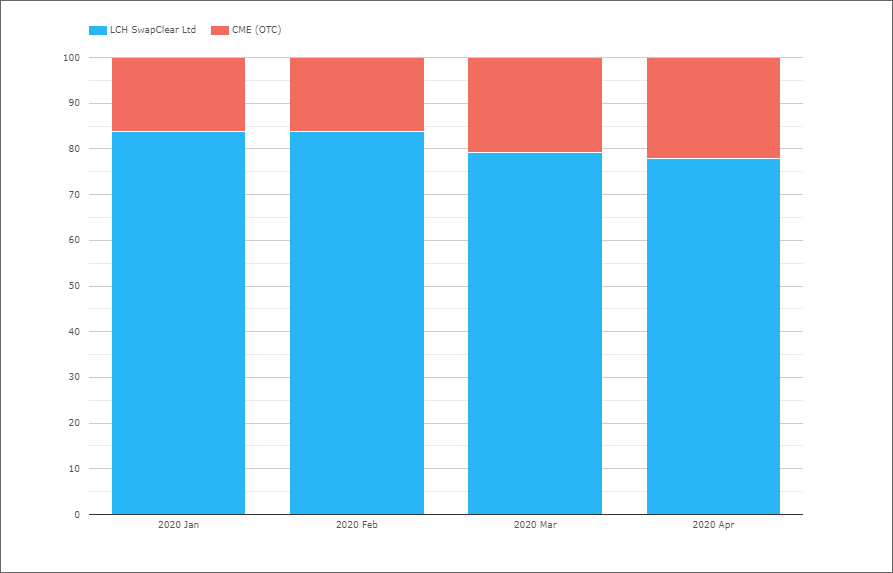
We see that the CME share increased from 16.2% in each of January and February to 20.8% in March and 22% in April, again of almost 6%.
So the narrowing of the basis has resulted in higher volumes at CME.
Or is it reverse?
Or indeed a feedback loop between them?
It will be interesting to keep an eye on this share in the months ahead.
CCP Switch Trades
The market is also active in CCP Switch trading between CME and LCH and in SEFView we can track this volume. Let’s do this and chart the gross notional traded in each of the last four months.
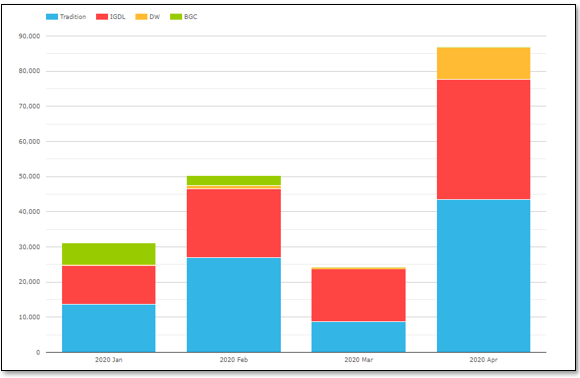
Showing that while March was a low month, April has seen almost $90 billion of CCP Switch volume between CME and LCH, with Tradition and ICAP/IGDL reporting $43 billion and $34 billion respectively.
And looking at April by tenor traded.
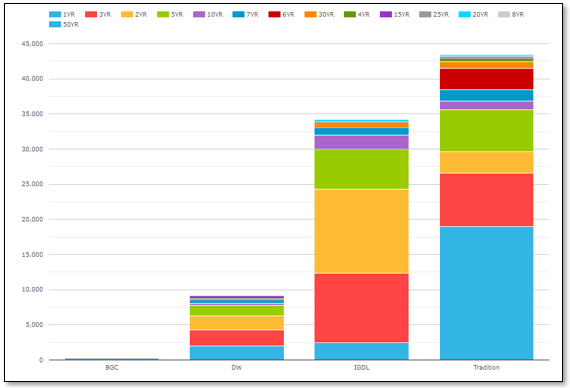
We see that 1Y, 3Y, 2Y and 5Y are largest gross notionals.
And even 50Y traded, with $50 million at IGDL and $90million at Tradition.
April volumes suggesting that some re-positioning took place between Swap dealers as a result of the elevated client volumes in March at CME.
Final Thoughts
The CME-LCH Basis Spread has collapsed and turned negative below 10Y.
This move coincided with the collapse in Swap rate levels.
CME has gained share over LCH client volumes, from 16% to 22%.
CCP Switch trades had a big month in April.
It will be interesting to see if May continues the recent trend.
Or reverts to January / February.
I guess it means the “free market” has big Uncle “Fed” looking after it: just as swap VOLUMES go UP, SPREAD come DOWN. imagine that!