- We run a real compression exercise through CHARM…
- …showing the potential IM reduction from a compression run
- Depending on the exact portfolio, the ratio of NPV unlocked to the IM released can be highly variable….
- …taking a recursive process to accurately assess your capital efficiency.
- This is exactly why pre-trade analysis of Compression using high quality, high performance engines such as CHARM is a pre-requisite to unlocking the true value within a swaps portfolio.
Old Data, Interesting Commentary
The BIS Quarterly Review for December 2015 was recently published. Of note in the Derivatives section was a look at Negative Swap Spreads (we’ve covered that enough here, here and here for now…) which follows on from their look at increasingly negative Cross Currency basis in the September edition.
But they also look at Compression in swaps, with three helpful charts that show the extent to which Compression is taking hold – and the particularly sharp decline in EUR swap notional outstanding:
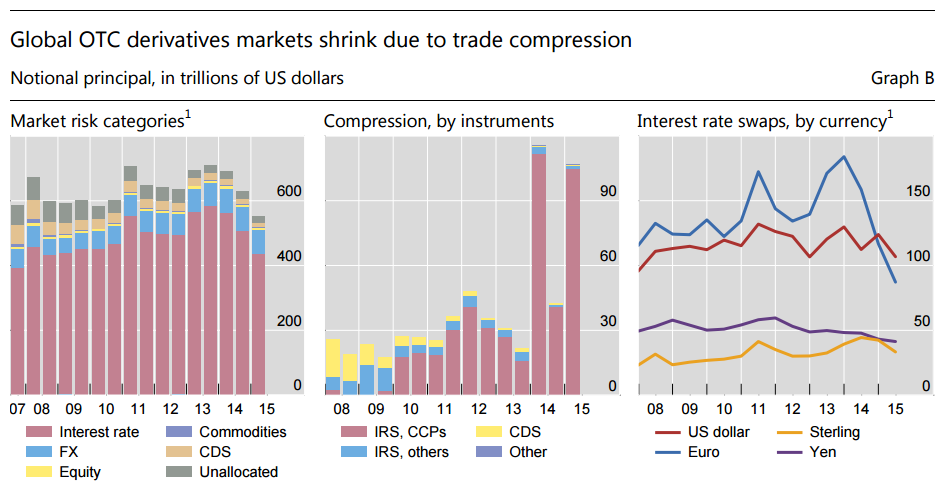
CCPView actually makes this drop in EUR swap notional outstanding even more stark. On a month-by-month basis for the past year, we can see a near-55% reduction in notional (red bar below):
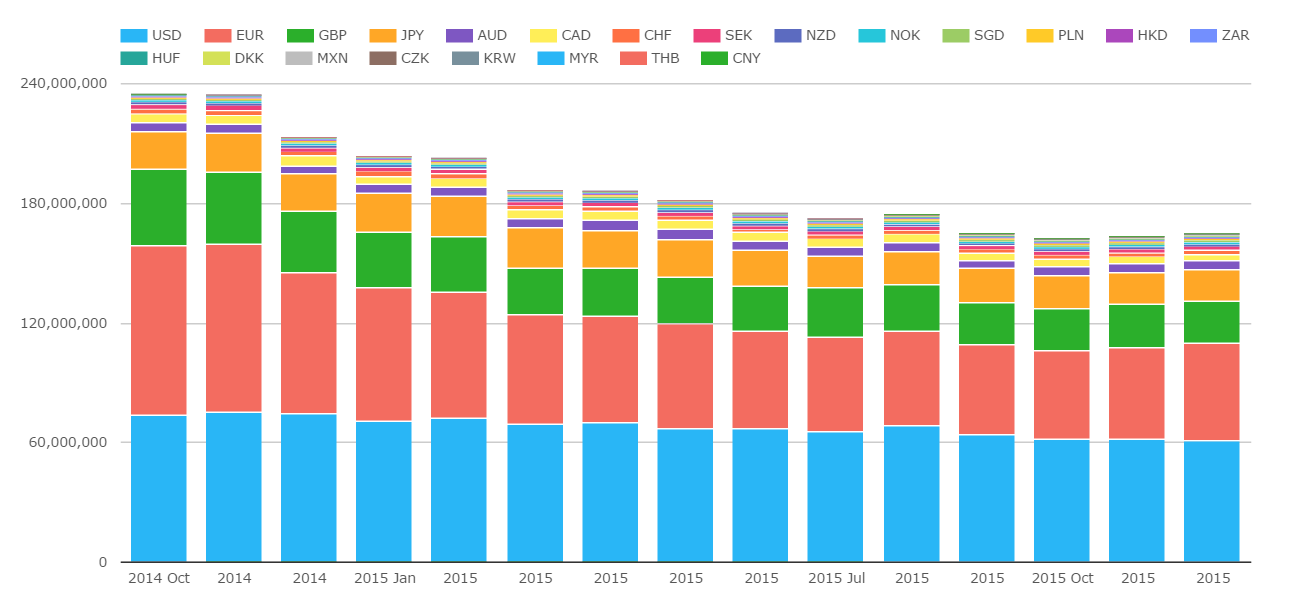
Showing;
- EUR Outstanding notional of $85trn in October 2014
- Reducing month-by-month-by-month to stand at just $50trn now
- Some of this is due to the declining EUR/USD FX rate (these are $ equivalents), but as BIS highlight, the rate of compression is still impressive
- Similarly, GBP swaps have seen a fall from $38trn to just $20trn now.
Compression in SDRView
As Amir highlighted in our recent Swaps monthly review, Compression in non-USD currencies was a marked feature during November. And when we look at both the notional and sheer number of trades being reported over the past two years as Compression, we see that it’s clearly a growth area:
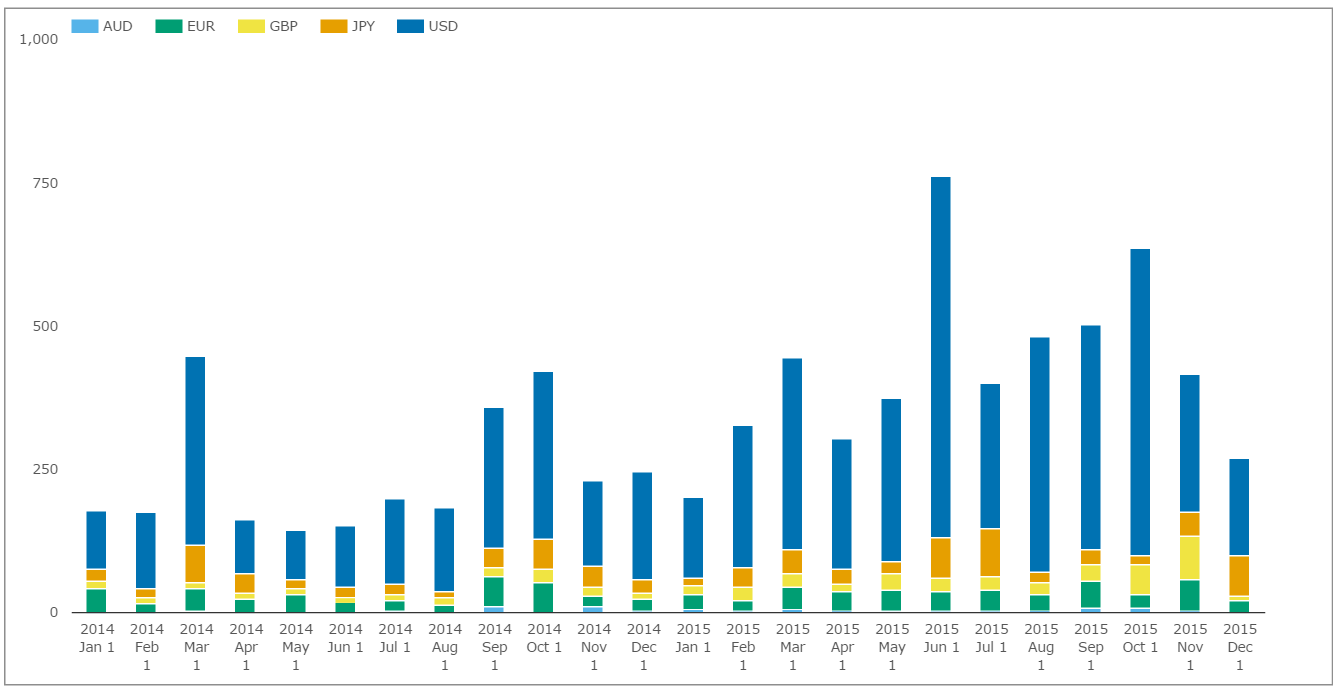
Showing;
- The lion’s share of Compression activity reported to SDRs is still USD denominated, reaching a peak of $750bn back in June this year.
- More recently, we are looking at around $500bn per month.
- Due to the workflow benefits, these are almost exclusively on-SEF volumes….
- ….highlighting a real sweet spot for how SEF trading is evolving to help STP and market structure…
- ….as well as creating a decent number of tickets for SEFs to process! We regularly see over 5,000 Compression trades per month, and this was as high as 8,300 in June 2015.
Where Compression gets…Complicated
I want to expand (quite a bit) on the points of why and how Compression is beneficial from Amir’s original blog way back in July 2014. Please have a read of that, as it introduces all of the key concepts. I’ll be adding some hard numbers to that below.
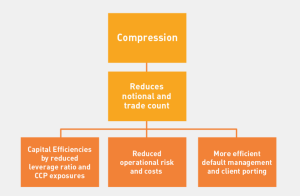
In a nutshell, the Swapclear website puts it best as to why people are so keen on compression (see right).
All of those things are true, but until you actually look at a real portfolio of trades, it’s not immediately obvious which trades you should compress. So I decided to do exactly that – take a list of real trades and see what the actual effect of Compression is.
Curated & Enriched Data
We flag between 35-40% of trades coming into the SDR as something other than an outright IRS these days. Compression trades are actually the biggest chunk of these at a fairly steady 12-14% (on a trade count basis).
So let’s take a real recent example of a compression run and do some analysis on the numbers. To find a list of trades, I wanted a decent size of portfolio – let’s say more than 50 swaps. And I didn’t want any block/capped trades included – so that I could make sure I was dealing with a “risk-neutral” package.
I settled on Clarus package ID 17263727 which had:
- 60 swaps transacted concurrently on 8th December 2015 at 15:30 (and 30 milliseconds) UTC.
- All back-starting USD swaps
- Each individual swap has an upfront fee associated with it
- The obligatory screenshot doesn’t make them look like anything too exciting:
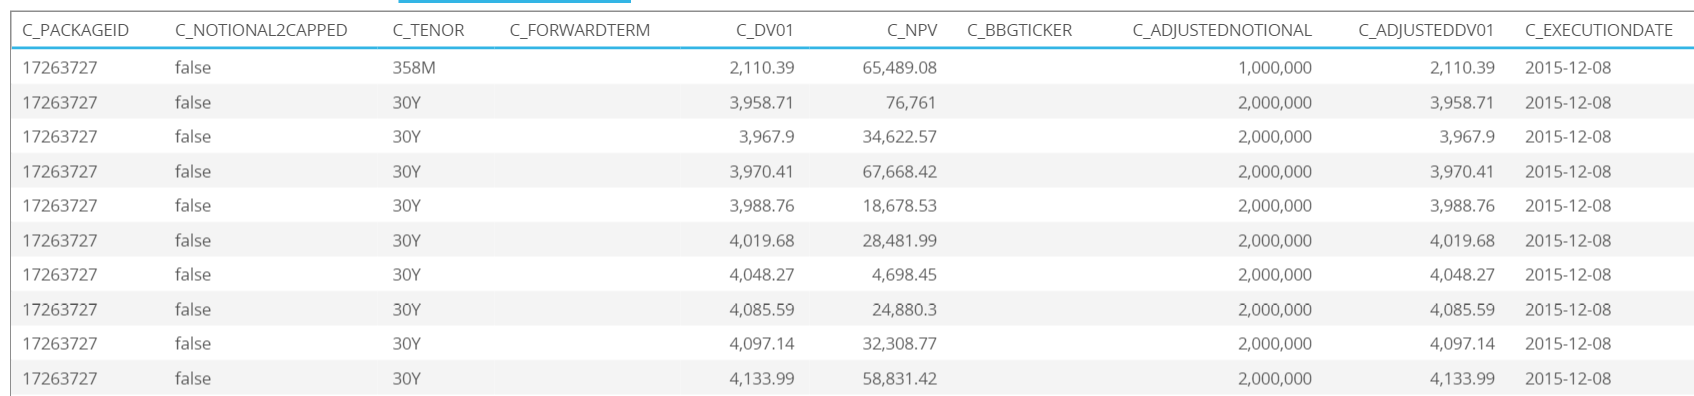
- But that C_DV01 column is vital….
- ….as it allows us to run a (fair few) simulations to try and work out which swaps were payers and which were receivers….
- ….which, when combined with the Tenor information, allows us to propose a few solutions as to which swap was a pay, which was a receive, and how this impacts the risk of the portfolio as a whole.
Risk Profiles
Now this process is interesting – not because you need to do this on your actual portfolio – but because it highlights how sensitive the Compression results can be to exactly which swaps you choose to compress. Let me explain.
For this 60 swap portfolio, I think I’m right in saying we have 2^60 possible combinations of payers and receivers. That’s a huge number – but what we want to do is find the combinations that are pretty much risk neutral, because that is the real world use case. So using the joys of brute force computing power, I ran through ten thousand possible combinations to find the 6 lowest risk portfolios.
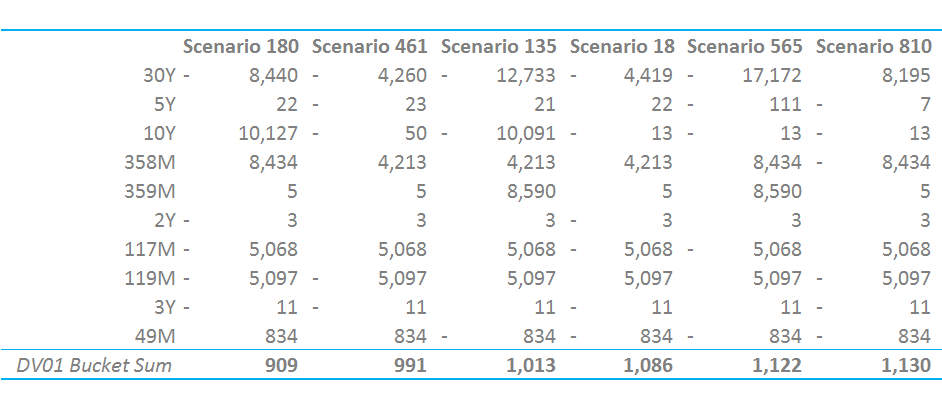
To solve for the “lowest risk,” I group the DV01s in like-maturity buckets. For this portfolio, we have 10 unique tenors, but I also group 117 month & 119 month swaps into the 10 year bucket. We get the “risk neutral” combinations on the right:
Showing;
- A very narrow range of total DV01s. We are dealing with a gross DV01 of $344,072, and yet our 6 lowest risk scenarios have a net DV01 ranging from just $909 to $1130. I think anyone would agree, they really are low risk portfolios!
- However, the permutations of bucket-risk within those scenarios is surprisingly high. Scenario 180 has a decent sized 10y30y spread position, whilst Scenario 461 is much lower risk within each bucket.
So, I wanted to use this post-trade process of trying to work out what is the most likely combination of payers and receivers to also instruct the pre-trade process of choosing which exact swaps to compress. And the results are very interesting.
This Particular Portfolio is Interesting….
….because we also have the fee paid on each swap. Therefore, as well as combining the DV01s, we can also combine the agreed mark-to-markets. So let’s fire up CHARM and do some proper analysis on this portfolio.
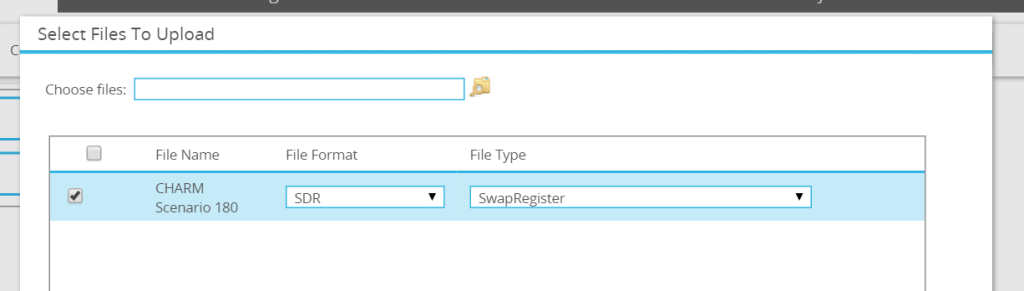
We can easily import the trades into CHARM, as we recognise the SDR SwapRegister format. Handy for these purposes, but also for anyone reporting to an SDR as well!
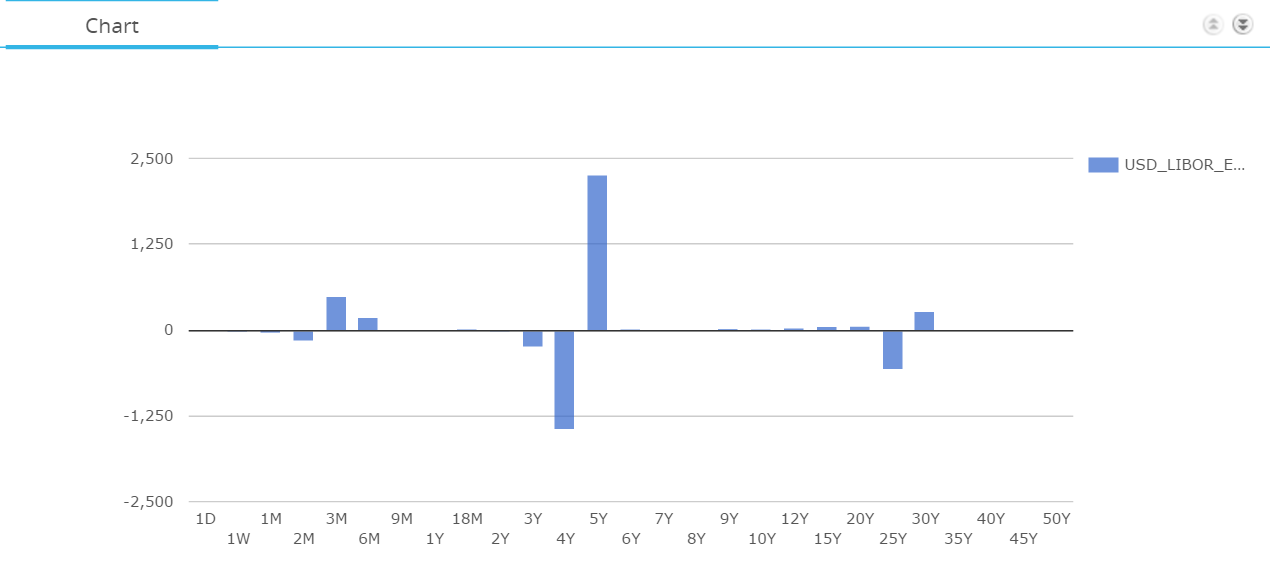
Scenario 180
First, the exact risk profile is pretty much risk-neutral, albeit with a 4y5y position (but in very small size):
Equally, our net Mark-to-Market is not huge (just $31,230) – and by running it on each swap individually, we can ascertain the direction of each fee (negative MTM = pay the fee, positive = receive the fee):
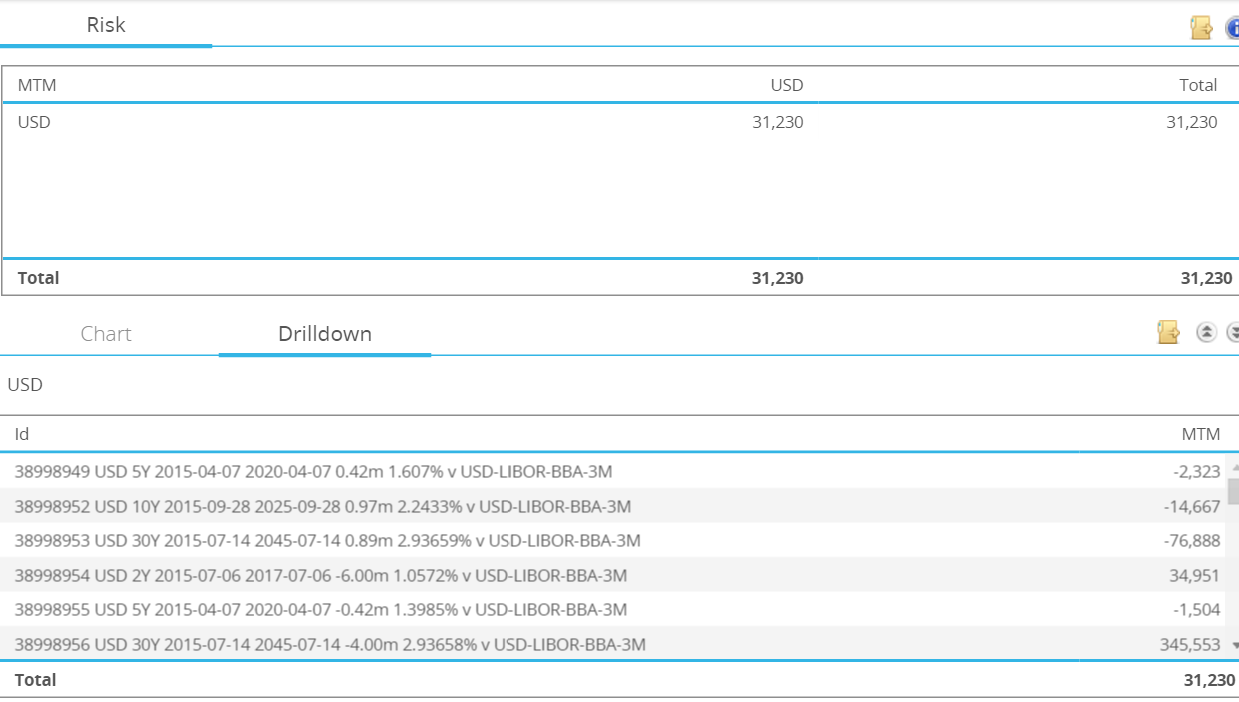
And of course onto IM! What is the IM impact from compressing this portfolio? Ideally, we’d run it against our whole portfolio to judge the incremental IM effect – just in case we are subject to any add-ons. But for the sake of this post-trade analysis, let’s just take the standalone portfolio to prove a point:

Showing;
- An IM requirement of $37,516
- Yes, $37,516 of IM
- For a portfolio of net DV01 <$1k and a Mark to Market of just $31,230!
- Why…..?
- The small outright position can be exposed to 30 basis point moves in the tail scenarios…
- …plus those pesky 4y5y positions (so small!) are exposed to moves around 4-5bp.
- Add-in the residual fixing risk at the short end, and it gets painful. Seeing 30bp moves between the 3M and 6M buckets can really hurt!
Wow, those numbers are compelling….
What am I saying here? In the extreme case, the IM can be greater than your mark to market, even for aged portfolios.
Therefore, whilst I may be sat on a net-positive mark-to-market portfolio, I’m not going to be able to extract that PnL gain as cash, due to the IM requirements.
Imagine joining a hedge-fund, with $X amount of capital at your disposal. You make $30k on your first swap trades in your first week, but you don’t get your full capital back when you “unwind” your position – because the IM due to the offsetting trades is more than the $30k you made…..ouch! Obviously you’d get back some of your original IM from unwinding the outright position, but you still wouldn’t get back to the same $X amount of capital that you originally had at your disposal. That’s quite a drag on your “alpha”….
But it’s not just this scenario!
Have a look below at the numbers for the next two Scenarios as well:
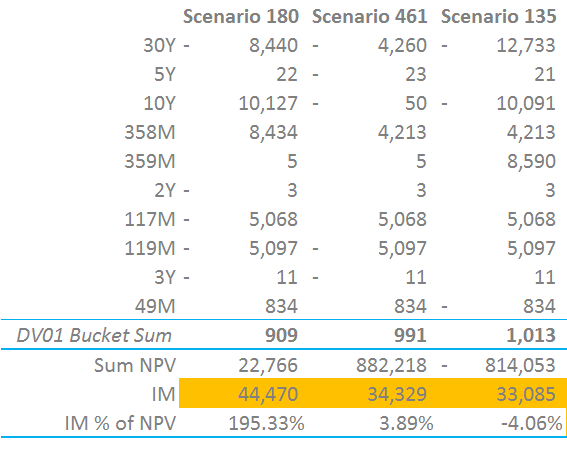
- The numbers are pretty counter-intuitive
- The Sum of NPV above is the sum of the agreed-to fees reported to the SDRs on the swaps – dependant on the direction of the MTM of each swap.
- With just the odd change in direction of small swaps, we see huge swings in the net NPV of the portfolio, even with virtually no change in the net risk.
- So whilst we can “solve” for an outright minimal amount of DV01, this may not actually be the most efficient set of trades to Compress.
- It’s crucial to compare the IM amounts to the embedded NPV and use this as a driving metric from a capital efficiency stand-point. Why would you tie-up $22k of “value” in a portfolio when you have to post nearly double that in IM?!
- And of course, the numbers presented here are for a standalone portfolio. CHARM does this on real portfolios for our clients.
In Summary
In essence, we are looking at a multi-faceted problem that demands a lot of recursive computing power
Needless to say, that is exactly what CHARM does….
…and we are happy that our clients are able to harness the power of this analysis in multiple ways to make this kind of analysis possible.
So remember, if you need to unlock some PnL from your portfolio, think carefully about what is the most efficient way to do this!