Clearing Houses 1Q 2019 CPMI-IOSCO Quantitative Disclosures are now available, so lets look at what the data shows, similar to my CCP Disclosures 4Q 2018 article. Summary:
- IM is up for IRS, CDS & ETD with YoY growth of 6%, 15%, 10% respectively
- Quarter-on-Quarter IM in CDS was flat
- ICE Europe F&O and ASX CLF IMs were up 34% YoY
- ASX CLF, Eurex OTC IRS and LCH CDSClear with the highest QoQ growth percentages
- ICE Europe F&O increased it’s Default Fund both own and member capital
- LCH ForexClear with more members offering client clearing
- DTCC GSD & NSCC with much higher single day member VM and IM calls
Background
Under the voluntary CPMI-IOSCO Public Quantitative Disclosures, CCPs publish over two hundred quantitative data fields covering margin, default resources, credit risk, collateral, liquidity risk, back-testing and more.
CCPView has more than 3 years of these quarterly disclosures for thirty-one Clearing Houses, each with multiple Clearing Services, covering the period from 30 Sep 2015 to 31 Mar 2019. This disclosure data provides insights into trends over time at one CCP and comparisons between CCPs.
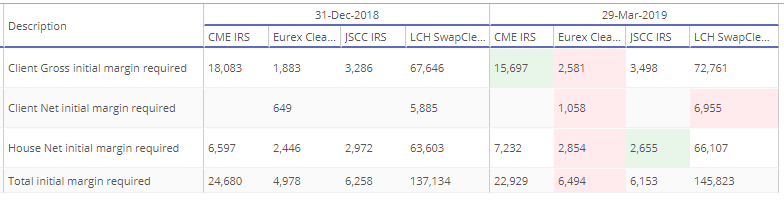
Initial Margin for IRS

- Total IM for these four CCPs was $181 billion on 29-Mar-2019, up $10.6 billion or 6% from a year earlier (YoY) and up $8 billion from a quarter earlier (QoQ)
- LCH SwapClear the largest with $146 billion of Initial margin, up $8.7 billion or 6% from the prior quarter (QoQ) and up $8 billion or 6% YoY.
- CME IRS next with $23 billion, down $1.75 billion or 7% QoQ and up $500 million or 2.4% YoY.
- Eurex OTC IRS higher than JSCC IRS for the first time, with $6.5 billion, up $1.5 billion or 30% QoQ and up $3 billion or 87% YoY.
- JSCC IRS with $6.15 billion, down $100 million or 2% QoQ and down $1 billion or 14% YoY
LCH SwapClear with the largest absolute increase in IM over the year, Eurex with the largest percentage increase and Eurex now with more IM than JSCC for the first time.
New feature
We have recently introduced a new feature in CCPView, one that allows our users to quickly see those disclosures that have changed more than a specified percentage from their historical range. Running this at 10% for the IRS IM required disclosures above shows:
Initial Margin for CDS
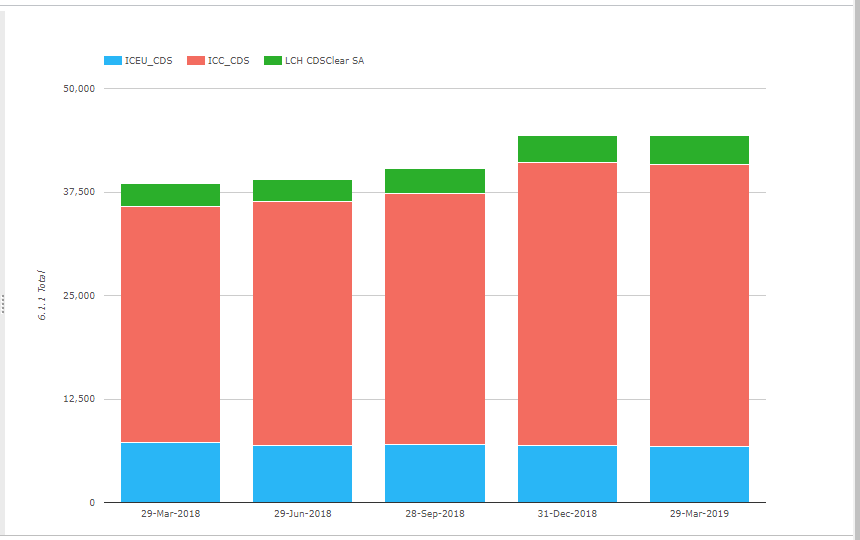
- Total IM for these CCPs was $44 billion on 29-Mar-2019, which is flat QoQ but up $5.7 billion or 15% YoY
- ICE Credit Clear by far the largest at $34 billion, unchanged QoQ and up $5.6 billion or 15% YoY.
- ICE Europe Credit next with $6.7 billion, down $250 million or 4% QoQ and down $570 million or 8% YoY.
- LCH CDSClear with $3.6 billion, up $500 million or 16% QoQ and up $725 million or 26% YoY.
CDS with no growth in 1Q19, but a strong 4Q18 means YoY growth of 15% is higher than IRS, albeit the Total IM of $44 billion is one quarter of the $181 billion of IRS.
Some signs that LCH CDSClear is gaining share over ICE Europe Credit.
Initial Margin for ETD
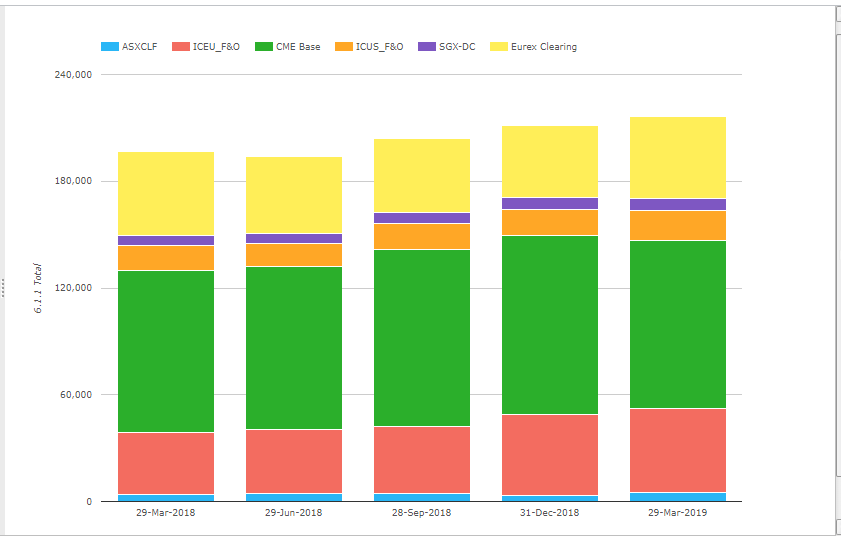
- Total IM for these CCPs was $216 billion on 29-Mar-2019, up $19 billion or 10% from a year earlier
- CME Base is the largest with $94.5 billion, down $6b or 6% QoQ and up $3.6b or 4% YOY.
- ICE Europe F&O with $47 billion, up $2b or 4% QoQ and up $11.8b or 34% YOY.
- Eurex Clearing $46 billion, up $6b or 15% QoQ, down $1b or 2% YOY.
- ICE US F&O $17 billion, up $2b or 14% QoQ and up $2.7b or 19% YOY.
- SGX-DC $6.9 billion, up 1% QoQ and $1.2 billion or 22% YoY
- ASX CLF $5 billion, up $1.5b or 41% QoQ and up $1.2b or 34% YoY
ICE Europe F&O with the highest growth rate YoY, followed closely by ASX CLF with SGX-DC next.
Other Disclosures of Interest
There are lots of disclosures for clearing houses and other measures such as margin, default fund, credit risk, liquidity, margin models, back-testing and more; let’s highlight a few from the many CCPs we cover:
- ASX CLF Client IM required (6.1.1.) is at a new high of $3.5 billion, while the percentage of total participant cash invested in securities (16.2.15) is at a low of 31% , while cash deposits are higher
- B3 – Number of clients (19.1.1) is 193,543 up from 132,701 QoQ, which is a high increase, presumably these number represents the number of client accounts and not distinct clients, still a massive increase, prior quarters were 132,701, 60,222, 54,237 and 55,607.
- CC&G Bond – the Estimated largest aggregate stress loss in excess of initial margin caused by the default of any two participants (4.4.7 Mean Average) is $2.7 billion, significantly up from $2.1 billion.
- CCIL – the total number of failures affecting core systems in clearing over the previous 12 months (17.3.1) is up at 15, from 11 and 4 at prior quarter ends.
- CDCC – the Estimated largest aggregate stress loss in excess of initial margin caused by the default of any two participants (4.4.7 Mean Average) is $1.6 billion, significantly up from $1.2 billion.
- DTCC GSD – the maximum total variation margin paid to the CCP on any given day (6.7.1) is $4.7 billion, up from $3b, $2.1b, $2.5b in prior quarters
- DTCC NSCC – the maximum aggregate initial margin call on any given day (6.8.1) is $5.2 billion, up from $3.3b, $2.5b, $2.9b in prior quarters
- OCC – Total Initial margin required (6.1.1.) is $43 billion, down from $56b, $72b and $64b at prior quarters
- ICE Europe F&O – Default Resources have been increased; Pre-Funded Own Capital (4.1.1) is up from $156 million to $183 million, while Participant Contributions (4.1.4) is up from $2.8 billion to $3.4 billion
- LCH ForexClear – the number of members that clear for clients (9.1.2) is up to 14, from 11 in Dec-18
- Nasdaq Clearing FM – the number of general clearing members (18.1) is 26, up from 20 in Dec-18
- NCC Securities – Total initial margin required (6.1.1) is $12.3 billion, up from $5.3 billion
- SIX Cash Markets – Total initial margin required (6.1.1.) is $1.2 billion, up from $900 million
More Disclosures
CCPView has disclosures from thirty one Clearing Houses, each with many Clearing Services, so there is a lot more data to look at covering Equities, Bond, Futures, Options and OTC Derivatives.
With over 200 quantitative data fields and quarterly figures from September 2015 to March 2019, that is a lot of data to analyse.
If you are interested in this data please contact us for a CCPView subscription.
We would appreciate your support.