In observing the markets over the last few weeks there are so many significant moves;
- Oil prices collapsing by 30% in a day,
- S&P500 declining 7.6% in a day, the 7th worst move since WW2 and worst since 2008,
- the whole US Treasury Curve out to 30Y trading below 1% for the first time ever.
In today’s blog I look at the falls in USD Swap rates and the impact on Swap margins.
USD Swap Rates
Let’s start with a chart of prices.
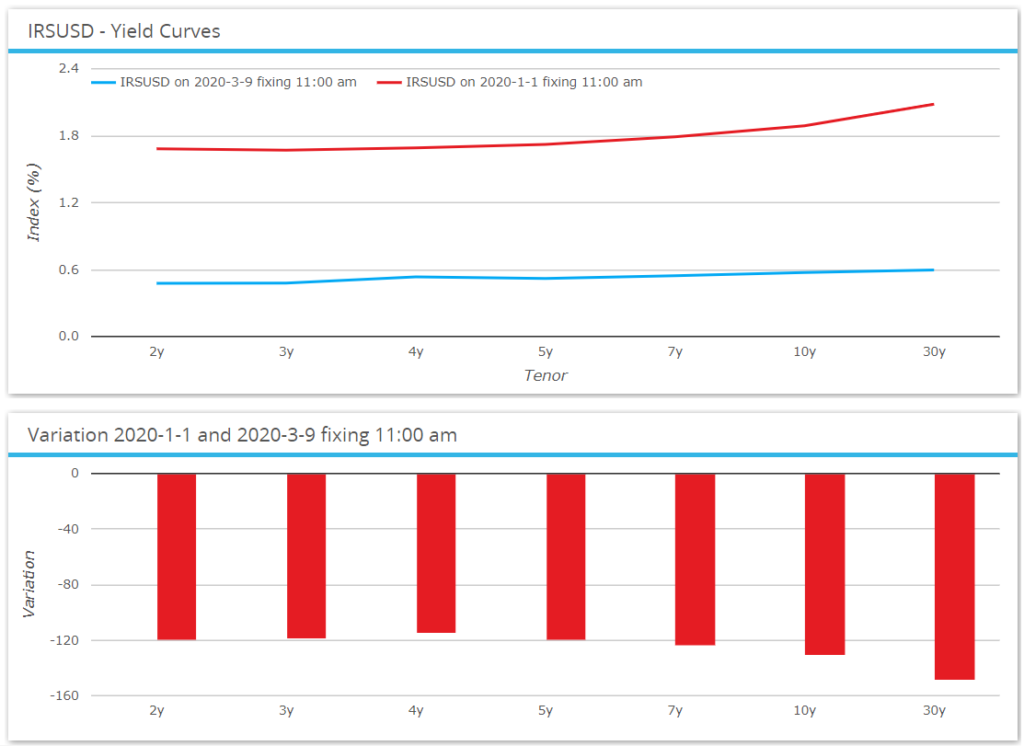
Showing that between January 1, 2020 and March 9, 2020 USD Swap rates declined -120 bps or more.
10Y Swap rates started the year at 1.88% and on March 9th were 0.57%, a fall of -131 bps.
A year earlier on March 11, 2019 10Y Swap rates were 2.66%, showing how accommodating Federal Reserve policy has been since it started reversing its 2018 policy of increases to get back closer to a ‘norm’ of 3%.
VWAP and Trades
The prices in the chart above are calculated as a volume weighted average price based on real trades executed up to 11am NYC (4pm LON) each day, meaning that we can drill-down to see how the market traded on a day.
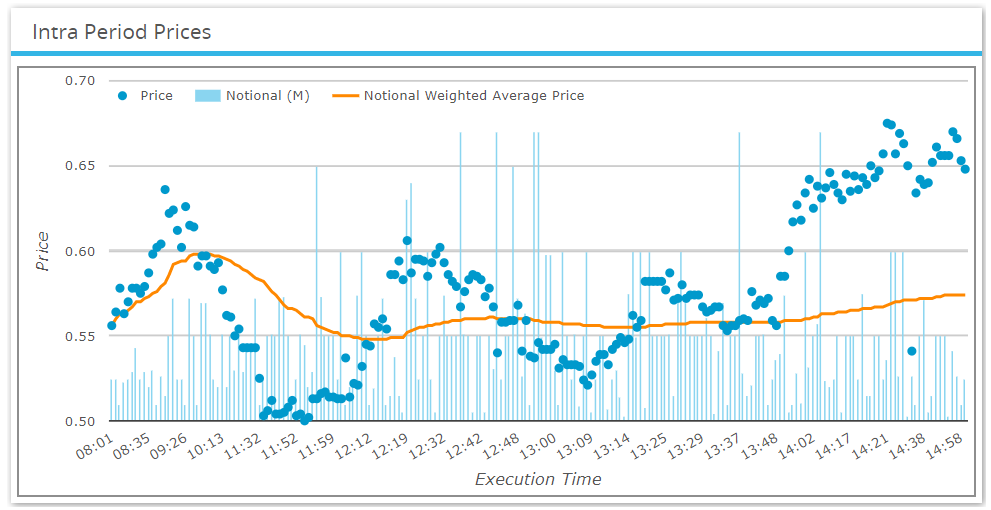
Each dot represents a trade, showing a a real roller coaster pattern over the March 9th London trading day, a total of 209 trades with total notional of $10 billion, a few trades printing at 0.5% or just under and the orange line showing the VWAP price.
And the same for 30Y Swap rates.
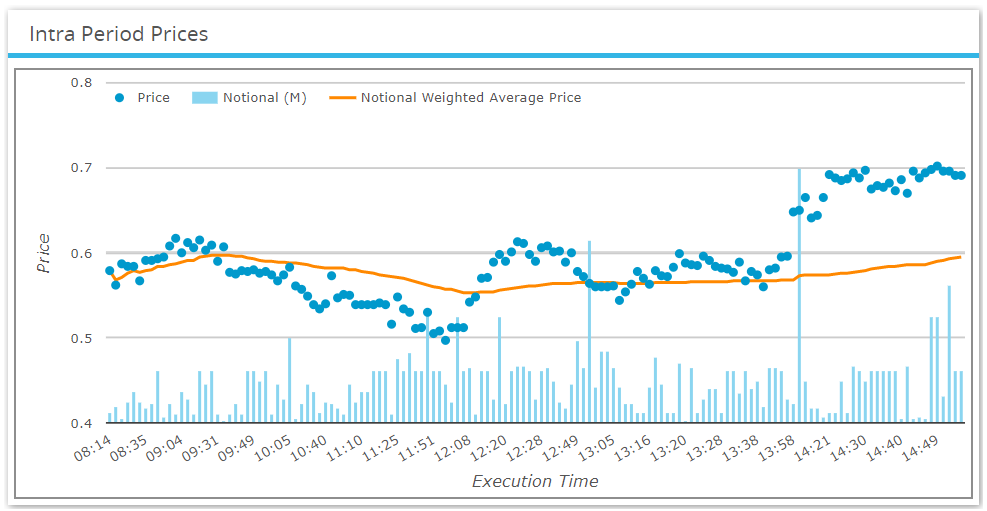
Again we see a few trades at or below 0.5%, with the VWAP ending at close to 0.6%, incredible levels that we could not have imagined for 30Y Swap rates at the start of 2020!
Daily and Weekly Declines
To understand the impact on cleared Swap margins, we first need to look at the magnitude of daily and weekly swap rate changes. Let’s do this for 10Y Swap rates from January 1, 2020 to March 9. 2020
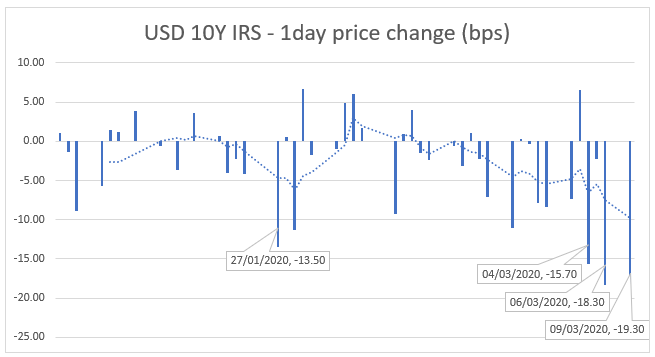
Showing the magnitude of the falls on selected dates, the worst being -19 bps on March 9th and seven days in the period with declines of -10bps or more.
Next a chart of weekly or 5-day price changes.
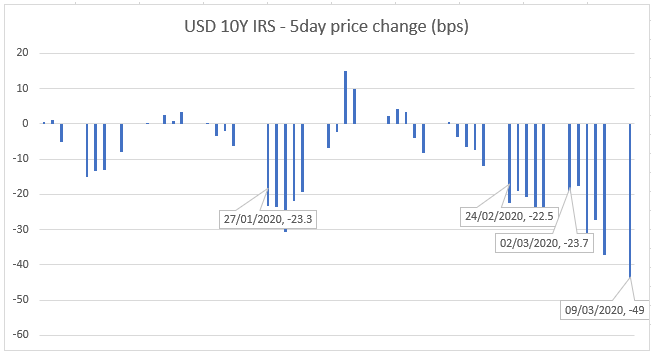
Showing that the worst 5-day move was -49 bps for the period ending on March 9th (inclusive).
Variation Margin
The price changes above are reflective (though not exactly the same) as those used by Clearing Houses for their variation margin calculations. The result being that a 10Y pay fixed Swap with $100k DV01 would have required a variation margin payment of $1.9 million on March 9th.
As clients at clearing houses are generally paying fixed, a client Swap portfolio with $1 million DV01 in 10Y would have required $19 million of cash variation margin on the day after March 9th.
And over the period February 6th to March 9th, the drop of -100bps, would have required $100 million in cumulative variation margin payments had the client kept open their $1 million 10Y DV01 position over this period. Certainly requiring a lot of liquidity to maintain the position.
Initial Margin
Initial Margin for cleared swaps is determined using Historical Simulation with a price history of 5-day moves, which are then adjusted for client clearing by a factor depending on the clearing house, at LCH SwapClear this factor reflects a 7-day margin period of risk (MPOR).
Let’s look at how or indeed if Initial margin at LCH SwapClear changed over this period of market volatility and do so using our CHARM product.
On February 28th a USD 10Y pay fixed Swap of $103m notional at par, required IM of $4.7 million for a house clearing member position or $5.4 million for a client position.
While the same trade done at par on March 11th but with $100 million (adjusted to give the same dv01 at lower rates than those on Feb 28th), shows the following in CHARM.
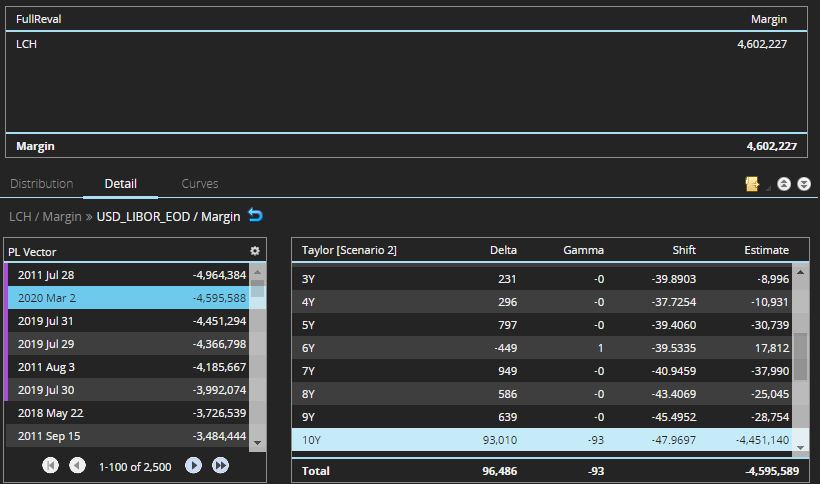
A similar IM of $4.6 million ($5.4m for client) and one of the six worst-loss tail scenarios that determine the IM is dated March 2, 2020, so in our recent volatile period.
This has a PL of $4.6m and a 5-day shift of -48 bps, pretty close to the -49 bps we saw in our 5-day change chart above. (The difference in dates is due to LCH using the start date of the 5-day period, while in my chart I used the end date of the period).
But even with this new tail loss scenario being included in the worst six, the move in 10Y is not significant enough to change IM.
Initial Margin for USD 30Y USD Swaps
The situation for 30Y pay fixed trades is quite different.
On 28th February a $100K 30Y pay fixed Swap (notional $39 million) had an IM of $4.6 million for house and $5.4 million for client at LCH SwapClear.
While the same risk trade today (notional $36 million) in CHARM shows:
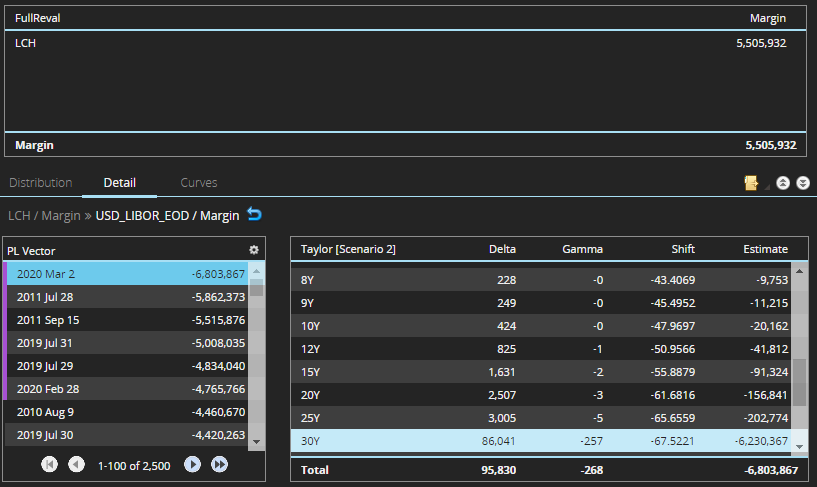
A higher IM of $5.5 million (cf $4.6 million) for House and $6.5 million for client (cf $5.4 million).
The main cause is a new worst loss scenario with a loss of $6.8 million, resulting from a -67 bps decline over 5-days in the 30Y rate; much higher than the previous highest loss of $5.9 million resulting from market moves end July 2011.
So clients with net 30Y pay fixed positions will not only have had to meet cumulative VM calls but also increase the amount of IM they post to FCMs/Clearing Brokers to the tune of $1m for each $100k DV01.
An additional $10 million for a $1 million 30Y DV01 portfolio.
Not in-significant but certainly less material than the VM calls over the period.
While received fixed portfolios will have faced the opposite, a lot of cash VM received and little/no change in IM.
That’s It
I had wanted to take a deep dive into Swap volumes next.
But that is all I have time for today.
We have looked at details of the steep decline in Swap rates.
And what this has meant for Swap margins.
Clarus Data and Analytics, help in understanding the market.
Please contact us if you are interested to learn more.
Helpful analysis Amir.
Regards,
Guy