SEFs in 2015 have seen huge increases in Cross Currency volumes, seemingly as a result of ECB QE. European credit markets are a hotbed for foreign issuers right now, and this is driving a significant shift to On-SEF trading for this asset class.
The FX Effect
It’s certainly not new news that EUR/USD FX is plummeting, and has been on a sustained downward path since the beginning of May last year:
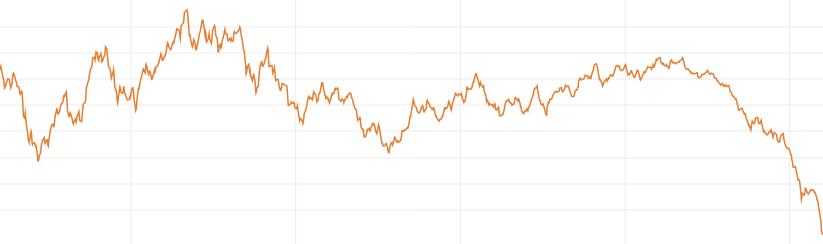
For SEFs plying their trade in EUR-denominated products, this could mean a collapse in USD revenue terms. However, to the contrary we can see in the SDR and SEF data that one portion of the European market is actually benefiting from this move – EUR/USD Cross Currency Swaps. And going hand-in-hand with this, the SEFs that serve this market are seeing large volume increases.
2014 vs 2015
As trade reporting becomes the “norm”, it offers us an ever-increasing data set to interrogate. And now, we don’t have to look at volume data in isolation. Below, we can see the EUR/USD Cross Currency Swap volumes for the first 10 weeks of 2015, against the same period in 2014:
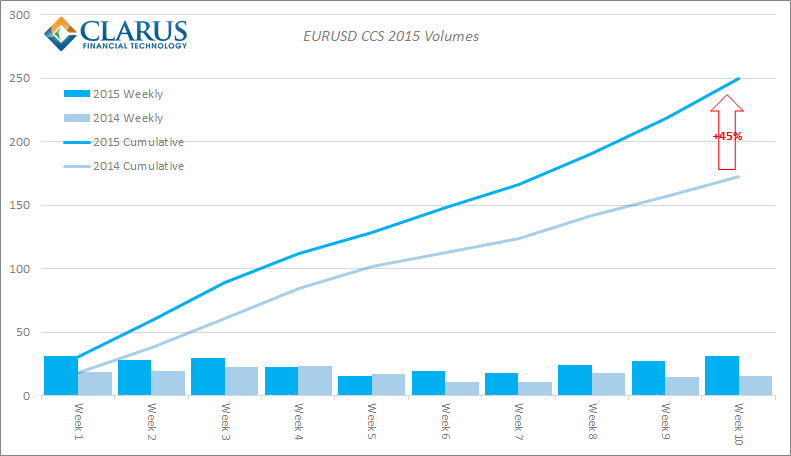
The chart shows a huge 45% increase in traded notional. If we were looking at it this in EUR-terms, this could be easily explained by the FX moves we have seen and we might expect to see comparable USD notionals on a year-on-year basis. However, this chart shows USD notionals (in billions). Therefore, the growth in volumes is truly impressive during 2015!
What is driving the growth?
There have been a number of articles commenting on the raft of EUR bond issues that we have seen from overseas companies – mainly from the US. For example, the Economist summed it up pretty well last week:
“Thomson Reuters says that US companies have issued €18.6 billion of debt so far this year, a record for the first two months of the year, and 160% higher than the total for January-February 2014. Issuers have included AT&T, the telecoms group and Kellogg.”
And Bloomberg have an additional take on the debt being issued, suggesting that it is not as cheap as it looks.
Looking at SDRFix (graph below), we can see that Bloomberg are correct – the EUR/USD CCS fixings have moved over 25 basis points lower this year.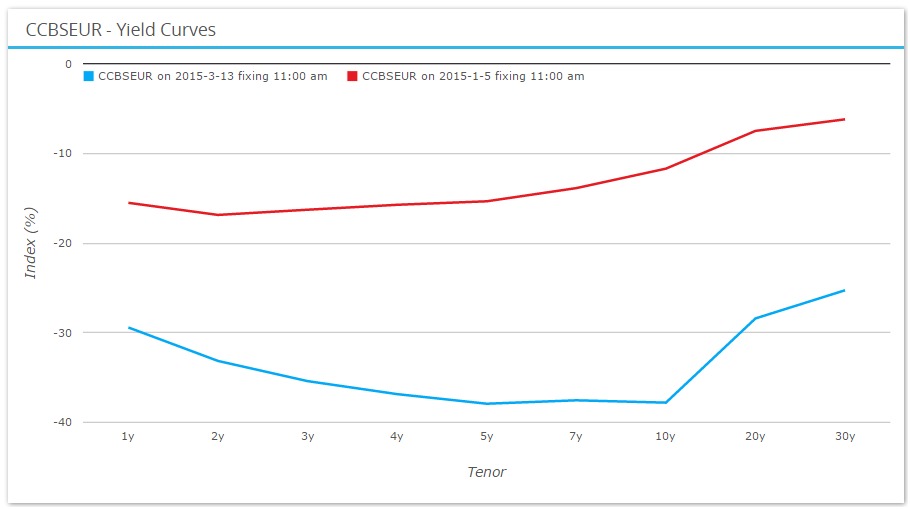
Just a bit of economics….
Cross Currency Swaps have traditionally been a flow-driven market. However, the global repercussions of QE policies have also made them an attractive place to take positive-carry macro positions – which in turn can drive some of the market moves we are seeing. For example, there are a number of reasons that make currencies subject to QE an attractive place to issue debt:
- QE increases the scarcity of government-issued debt. Assuming a constant demand for debt instruments from investors, corporate credit can step in to provide the supply.
- QE reduces credit spreads, making it more attractive for issuers.
- For multi-nationals, it can be attractive to issue at the outright lowest yields possible, and service that debt via local earnings.
- For US companies, it can be more efficient to keep profits “off-shore” and use these profits to service and pay-down non-USD denominated debt.
In isolation, each of these motivations may not be enough for a company to choose to issue in EUR. However, put them together and we see somewhat of a “perfect-storm”. This is why we see the most “issuance-sensitive” areas of the curve (5y through to 10y) at their lowest levels for quite some time. The big question (as with all macro QE moves), is whether the market has therefore priced-in the full QE effect or whether the physical purchases of EUR bonds by the ECB will extenuate this move.
And which SEF wins….all of them!
As well as this increase in issuance driving volumes, these additional volumes are all trading ON SEF. We can also see a change in market behaviour, with the existing volumes migrating towards On-SEF trading. Conversely, this is best shown when we look at Off-SEF volumes in 2015 versus 2014:
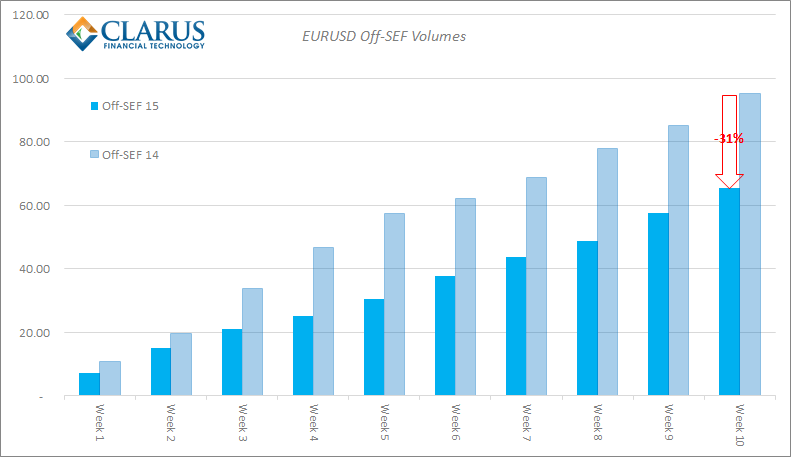
In a market that has seen a 45% increase in volumes overall, a 31% fall is a worrying sign for Off-SEF trading- it looks like it is becoming far less palatable to market participants to trade off facility.
It we were to place a caveat on that, we could say that US Persons may have been more active in 2015 (e.g. as a result of the increased issuance from US names) – and hence distort the SDR figures somewhat. However, it seems unlikely that US names alone could have such an outsized impact on market activity – they are beholden to the liquidity provided from European names after all. It therefore appears likely that Europeans are increasingly trading on-SEF for this asset class.
SEF Market Share
With such a large increase in volumes, it is fair to say that all of the SEFs have been big winners from increased Cross Currency Swap volumes. For example, ICAP are the clear market leader, and have still more than doubled their volumes from last year! As can be seen from the chart on the right, the absolute increase in volumes is huge: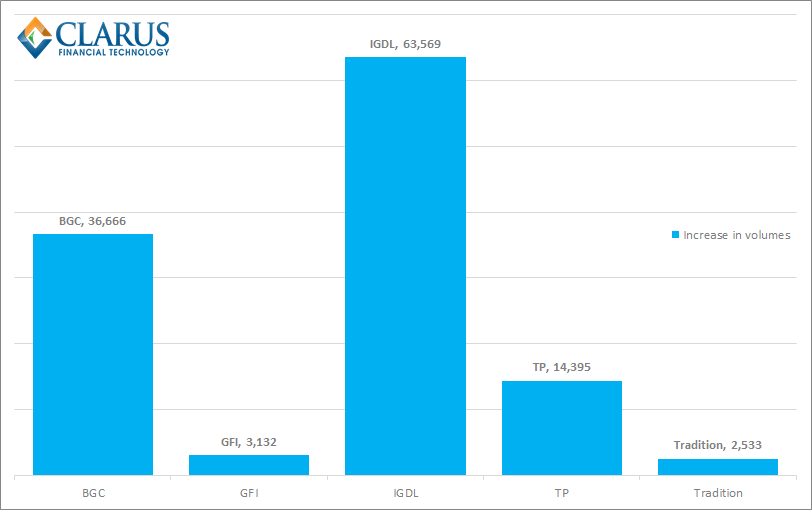
Amazingly, ICAP’s increase of $63bn YTD has not allowed them to maintain the same market share as they enjoyed in 2014. Of course, this should be taken with a pinch of salt, given that their competitors were starting from a much, much lower base.
Our final chart shows the winners and losers on a year over year basis, along with their 2015 market share for the same 10 week period. It looks like the big winner is the BGC SEF, where a sizable increase in volumes has, on the whole, eaten into ICAP’s market leading position: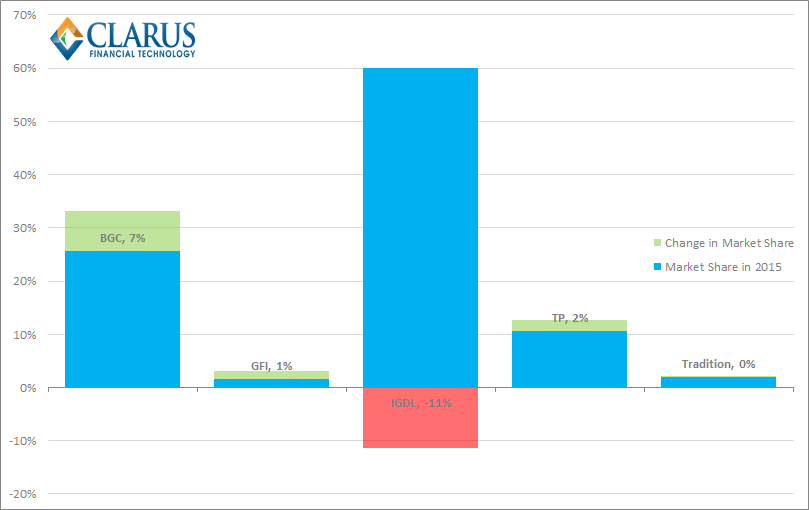
Overall, it looks like this is going to be a story that continues to evolve, particularly as ECB bond buying picks up. Here at Clarus, we were relatively early in identifying the structural shift due to ECB QE in our review of 2014, with 10 year EUR/USD cross currency swaps some 13b.p. lower than when we published that article.
In such a fast-paced environment, it will be fascinating to see how the figures begin to settle in Q2 2015 for both market levels and which SEF comes out on top.