I began looking at Mexican Peso swaps last week and was struck by the amount of activity we can see on the SDR, and the degree to which they were being cleared. It does raise some questions that I don’t believe I have the answers for, so I thought I’d put it out to our readers to see if you have any insight, and frankly it’s somewhat interesting.
Amir first wrote about MXN interest rate swaps back in December 2013 and then again in December 2014 after the CME began to clear them. So apologies in advance to Amir for front-running what would otherwise be his Christmas 2015 analysis.
Let’s start by looking at shear trade count among the G4 currencies, plus our two closest geographical neighbors CAD and MXN:
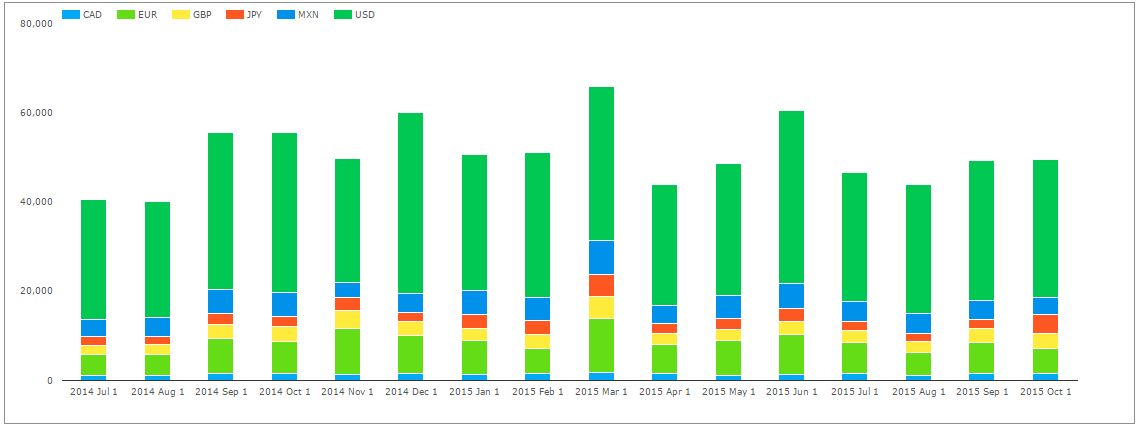
The large dark green bars are USD swaps, and accounts for the majority of swaps in every month. However I find it interesting that generally speaking over the past 15 months, there are more MXN interest rate swaps being reported to the SDRs than CAD, JPY and GBP. Why would this be the case?
One big caveat to this is the trade size. A quick check of SDRView Professional and we can see that the MXN swap market seems to be concentrated under 10 years, while the G4 currencies can be much longer dated. If I remove CAD and USD, and look at this same 15 month period but now in risk terms, I can see that while MXN has significantly more trades than GBP and EUR, it is in the minority in DV01 terms:

START GUESSING
Given the larger trade count yet smaller risk size, we can conclude the average trade size in risk terms is smaller. I might guess this means the activity we are seeing is more client driven.
Though why would the trade counts be higher than GBP, JPY, EUR and CAD? Would it be an accurate guess to then say that these clients generally do not have CSAs with Mexican banks, and hence tap into US liquidity?
TURN TO BIS
I got slightly excited when I found the BIS had published an update on OTC IRS in September of 2015, however that survey lumped MXN into “Other currencies”. So we have to go back to the April 2013 daily average turnover to get any insight:

Showing only 10 billion of average daily activity in MXN globally. So let’s run with this, and rewind the clock on SDRView to April 2013 and see how much of that 10 billion we see:
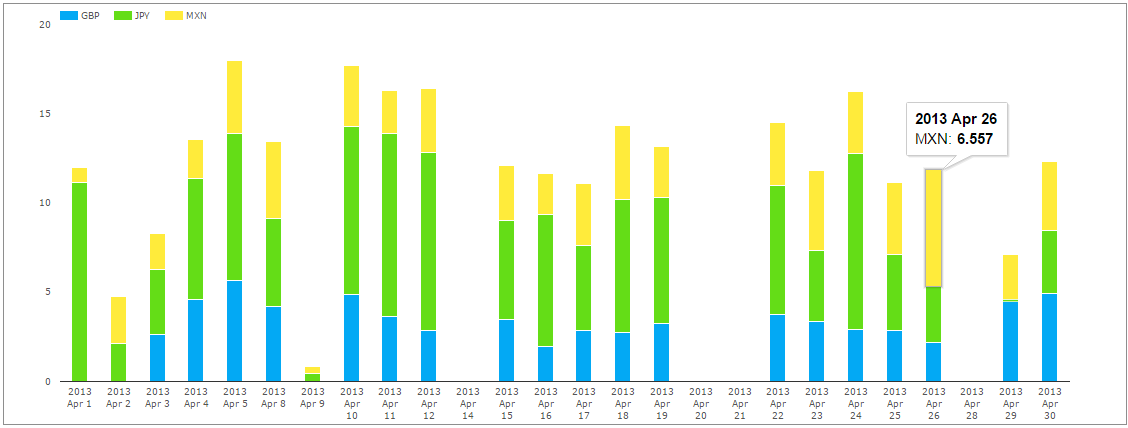
Assuming 22 business days in April 2013, the SDR saw just over 3bn, so what would seem to be over 30% of the global MXN swap market. Compelling.
CLEARING DATA
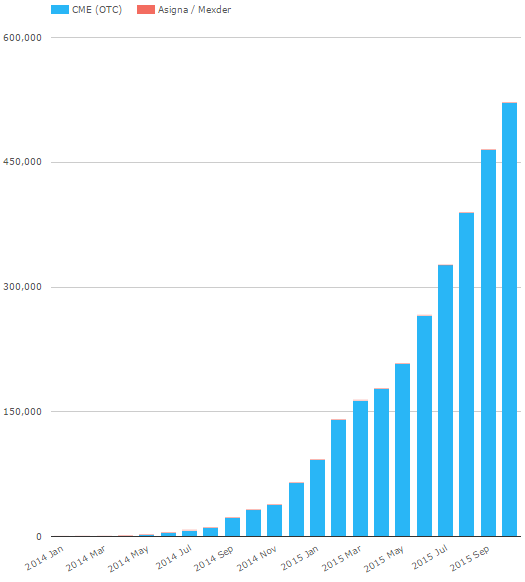
Turning to what we see on clearing houses, we can see there are only two clearing houses catering for MXN swaps, with nearly everything being CME (chart to the right).
The optimistic perspective here is that MXN swaps have been a huge success. The pessimist might say CME needs to start doing some compression on their MXN swaps!
I did reach out to CME after seeing all of this data and they were polite enough to confirm their success with some metrics:
- 61 Market Participants are now clearing MXN IRS:
- 26 hedge funds
- 20 banks
- 15 asset managers
- 42 of these began clearing in 2015
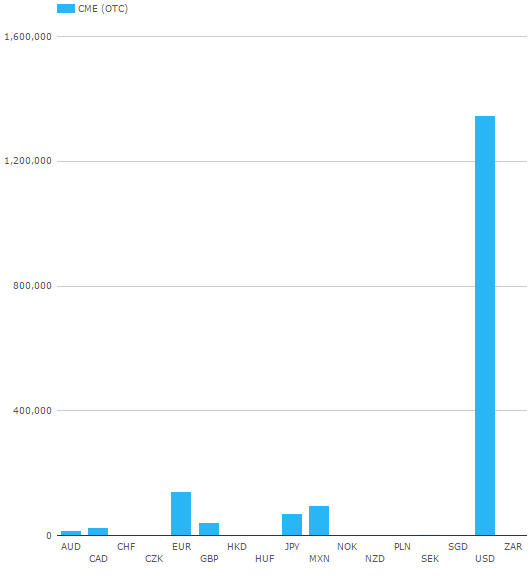
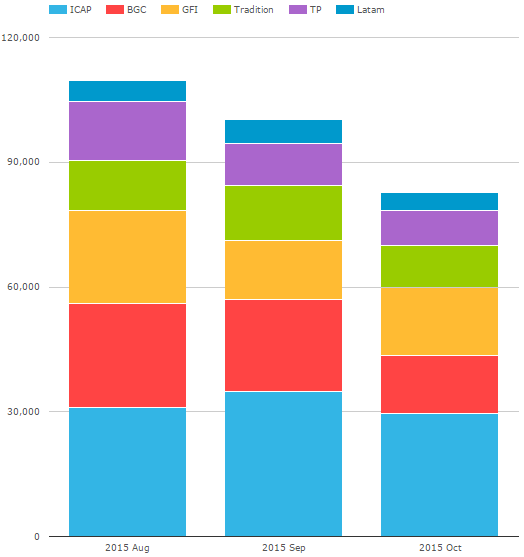
Another intriguing chart is this next one (to the right), showing CME volume for October by currency. MXN is now more active than JPY at CME!
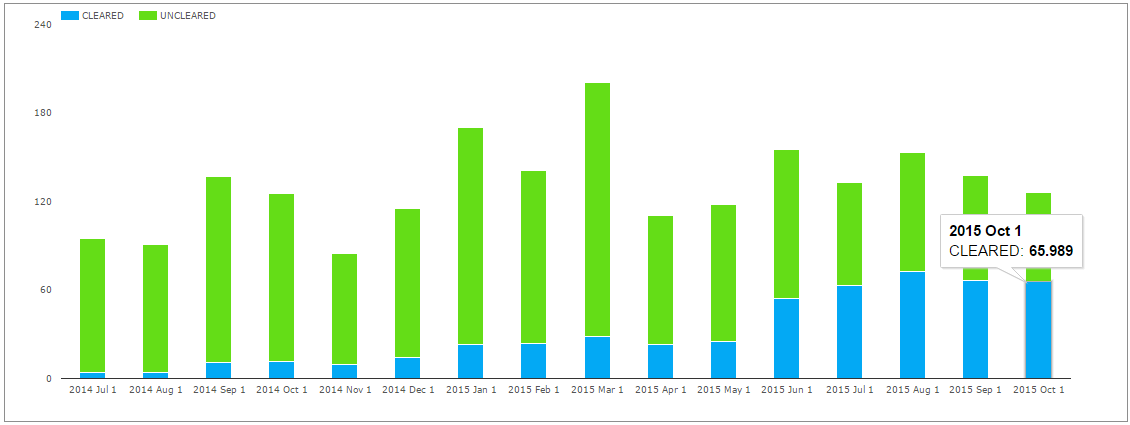
So how much of the market is now being cleared? The chart below shows that October 2015 was the first month on record where the percent of cleared MXN swaps (in notional terms) broke 50%.
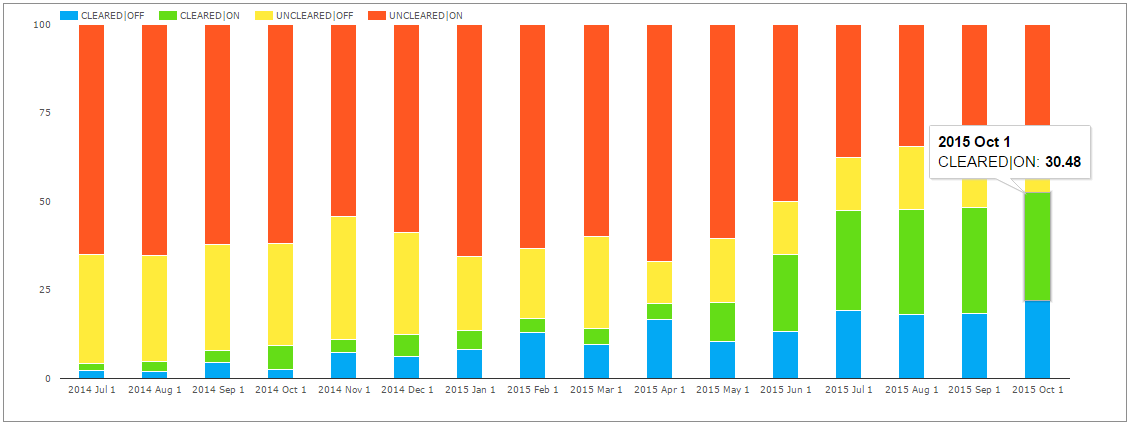
Going one level deeper, I now stack that same Cleared/Uncleared data by On/Off SEF, and in percentage terms. The CFTC should pin this one on their wall; this shows a remarkable increase in Cleared, On-SEF activity in MXN swaps – up to 30% now – and this is for a permitted product. Go CFTC !
And you should be able to make out that pretty consistently 60-75% of the MXN market has been traded on SEF.
SEF
No research is done until you look at the data on SEFView. I was hoping to corroborate my instinct that much of the MXN swap business is now client-driven and hence we’d see the D2C SEF’s put up some numbers. Alas, it would seem that the client-SEFs have never seen an MXN swap. Oh, dios mio!
So much for my inkling.
SUMMARY
So let’s recap:
- There are more MXN swaps reported to the SDR than JPY, GBP and CAD
- The SDR’s seem to have about 30% of the global MXN swap activity (using BIS as a yardstick)
- Clearing activity in MXN swaps has breached the 50% mark
- CME is the recipient of success in cleared swaps
- At least 2/3 of the MXN swap activity is traded on-SEF, all within the IDBs.
- 30% of MXN swap activity is now on-SEF AND cleared. Not bad for a permitted, non-mandatory cleared product
I had hoped to back up the data with some logical explanation. Alas my gut instinct was proven wrong, and it would seem the bulk of activity is small-sized inter-dealer activity, with off-SEF client activity taking up the other 1/3. So that is all for now. But please chime in with any further intuition you might have.