Following on from our look at June’s ECB meeting, and our prediction last week that markets would be shocked in the event of actual rate action, let’s take the opportunity to distill exactly what happened.
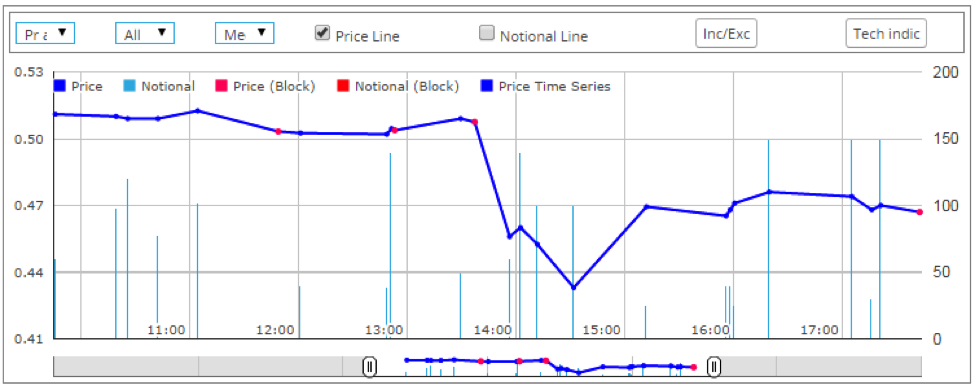
Using SDRView Pro the drill-down nicely shows the ECB’s impact, with 5 years printing at a low of 0.433% shortly after the rate cut:
However, this is only half of the story.
To start with, we can see that during stressed market conditions (i.e. a shock announcement from a central bank), SEF’s unfortunately play second-fiddle to the good old voice broker market. September 4th saw a measly €6bn of EUR swaps trade on-SEF, compared to €34bn in total trading throughout the day.
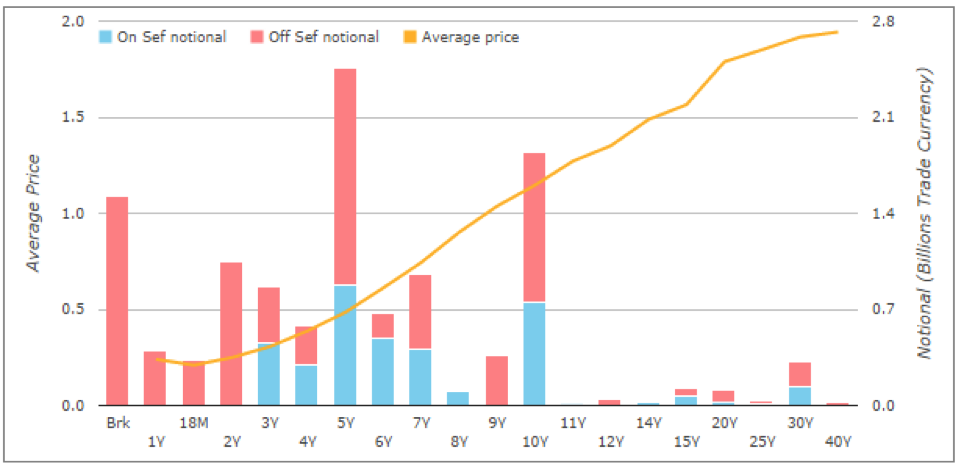
Just taking a cursory look at SDRView Pro, it appears that market activity focused on the 5 year area of the curve:
However, once we start to drill-down into the DV01 metrics across all Spot, Forward and IMM dated trades, we see an interesting story develop. Using the SDRView API , we project the DV01s for each trade onto a simple curve which allows us to generate the following time-series of DV01s for September 4th:
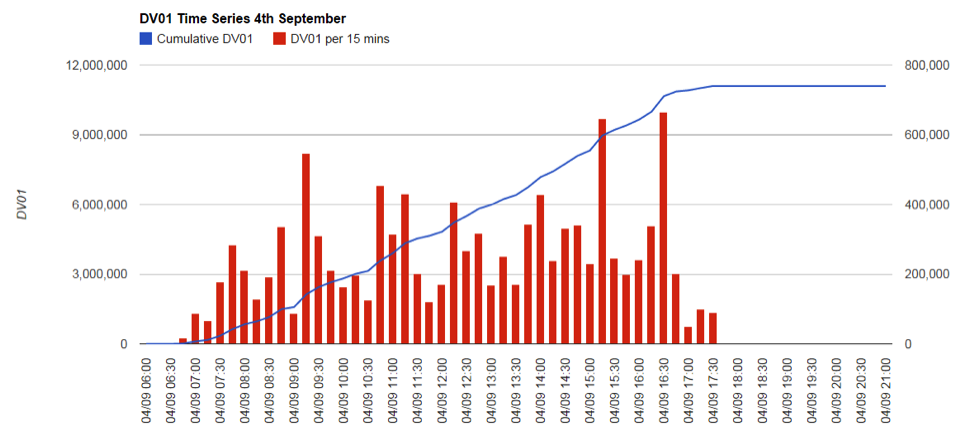
The chart shows:
- A total of €11.1m DV01 traded on September 4th.
- As we’ve seen in the past, the opening 15 minutes and the closing 15 minutes continue to be the most significant trading periods for volumes. On Thursday, €665k of DV01 traded at the close.
- We saw €406k trade in the immediate after-math of the Rate Cut – very different behaviour to the telegraphed move in June, when activity was confined to the press conference and closing windows.
As we’ve seen before, the swaps market can be a little slow to react to ECB policy, therefore it’s wise to also look at the activity for the following day. Repeating the analysis for September 5th, we see:
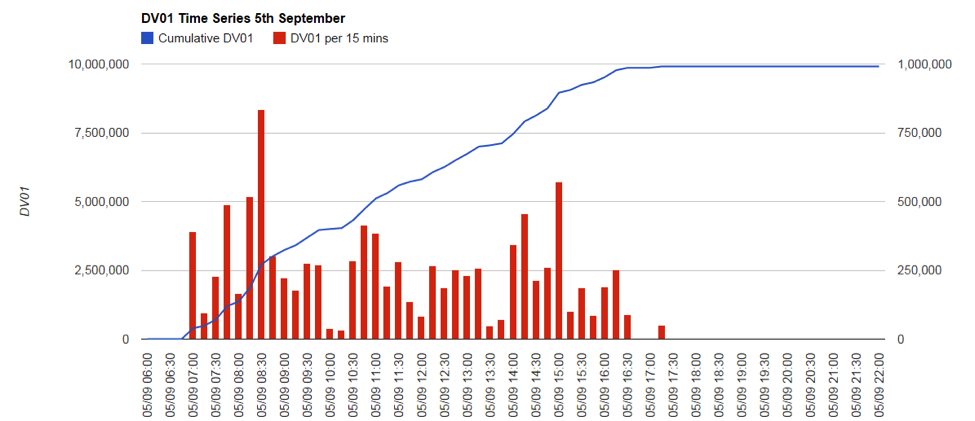
- A huge peak on opening trades, with €833k trading in the “first” 15 minutes. This is unusual behaviour as we normally see the close providing more than twice as much liquidity as the open. This strongly suggests a bout of Asian repositioning following the rate cut – maybe accelerating the Japanese move out of bunds?
- €9.9m DV01 in total traded, but over 27% of this risk had transacted before 08:30 GMT. Not the day for a breakfast meeting!
As always, we try to drill-down and look at what maturities were trading during these sessions. The profiles for both the 4th and 5th are certainly similar, highlighting the themes in the market. We focus on the “benchmark” 2y, 5y, 10y and 30y maturities for each day.
4th September:
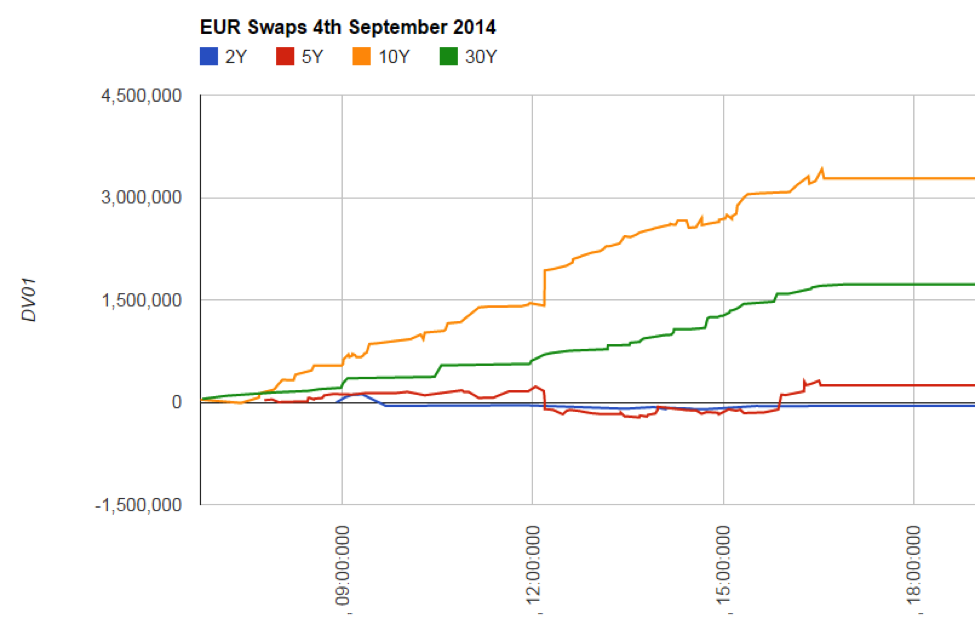
What a great chart! It easily highlights the significant difference between looking at notionals (as per our second chart), to the distribution of DV01s. The major difference lies in the 5y area of the curve. Remember, we simply bucket forward trades as their constituents – so a €100m 5y5y forward shows up as a negative €50k of 5 years versus a positive €98k of 10 years. From the fact the 5 year DV01 exposure closely tracks to zero, we can see that the market was hedging predominantly forward starting swaps with spot equivalents. The largest discontinuity on the time series’ also appears just as the ECB were cutting rates, and the following (chunky) 5y5y trades were reported:
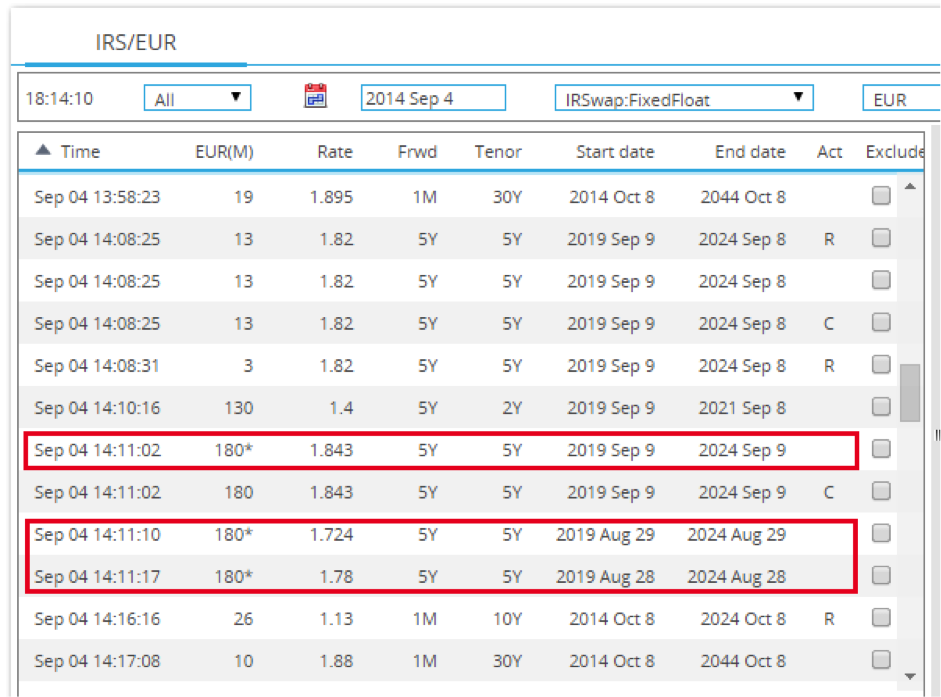
We see a continuation of the “forwards” element on Friday’s DV01 break-down as well:
5th September:
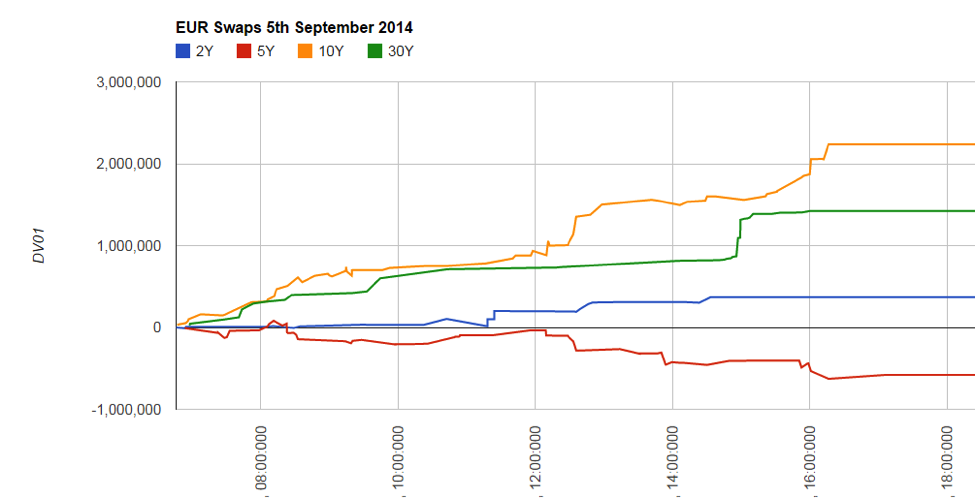
- There is an even larger exposure from forward-starting structures arising in the 5 year area of the curve.
- There is substantially more long-end (30y) activity on September 5th.
This DV01 analysis therefore highlights that, across the two days, it is actually 5y5y forward activity that is driving the 5y and 10y areas of the curve. Given this, it is equally important to acknowledge that the exposure of these structures is 2 times leveraged on the 10y area of the spot curve – which is overwhelmingly clear in the DV01 analysis.
As we looked at last week, these conviction trades in the market are highlighted by activity (either notional or DV01) and not just simple price measures. Incrementally, the power of the SDRView API is enabling us to expose this activity on a number of different levels.