Last week I briefly covered cleared EUR Swap volumes in Swaps Data: The Big Get Bigger in Cleared Swaps, so today I will look in more detail into these and specifically LCH SwapClear volumes by tenor.
Average Daily Volume (ADV)
Lets start with ADV by month for EUR Interest Rate Swaps cleared at LCH SwapClear, which for 1H 2018 represents 98.5% of the global cleared volume, the rest being at Eurex and CME.
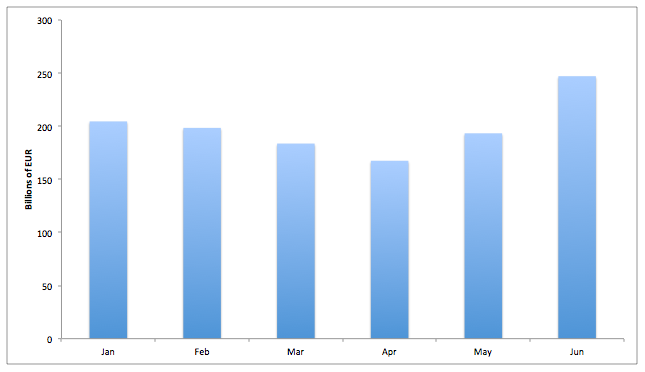
Showing an ADV of €205 billion in January 2018, a downward trend to €167 billion in April and then up to €193 billion and €247 billion in May and June respectively. (Note these are single-sided ADVs).
The highest single day in 2018 was on 21-June with €550 billion, so over twice the June ADV and far higher than the next highest day in 2018, which was 12-June with €344 billion!
ADV by Tenor bucket
Next lets take the recent 3 months and look at the ADV by major tenor buckets.
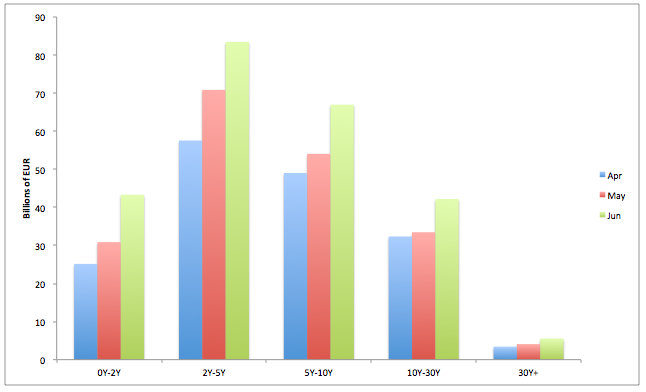
Showing increasing volumes in each tenor from April to May to June, with:
- 0-2Y tenor bucket an ADV of €25 billion in April, up to €43 billion in June
- 2Y-5Y, an ADV of €60 billion up to €83 billion
- 5Y-10Y, an ADV of €50 billion up to €67 billion
- and so on …
This shows the long tenor characteristics of Euribor Interest Rate Swaps trading.
Other Major Currencies
Lets compare this with the other major currencies; AUD, CAD, GBP, USD, in each of which LCH SwapClear has a dominant market share. Selecting just the month of May 2018 and calculating an ADV in each currency.
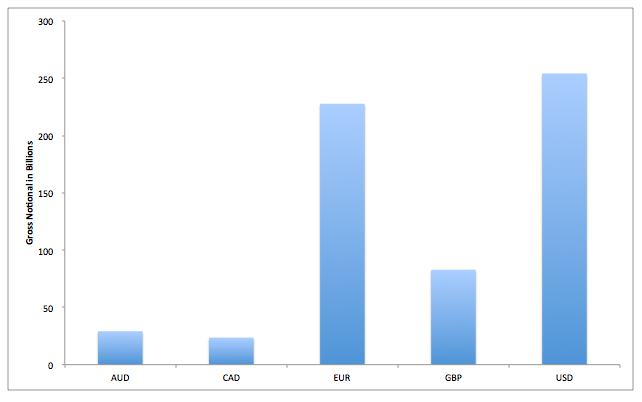
Showing
- USD IRS the largest with $254 billion
- EUR IRS next with $228 billion
- GBP IRS $83 billion, AUD IRS $29 billion and CAD IRS $24 billion
Then selecting EUR, GBP, USD in a chart broken out by tenor bucket.
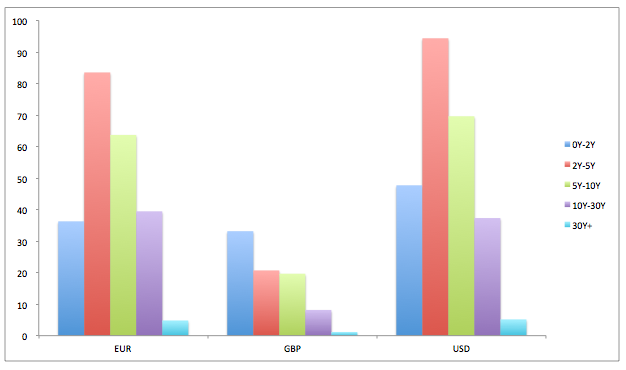
We see that USD IRS reflects the same pattern as EUR IRS, except that 5Y-10Y is relatively higher compared to 10Y-30Y in USD than EUR. In contrast GBP shows a a shorter average tenor, with 0Y-2Y the highest in gross notional terms; so less dominance in the 5Y to 30Y term.
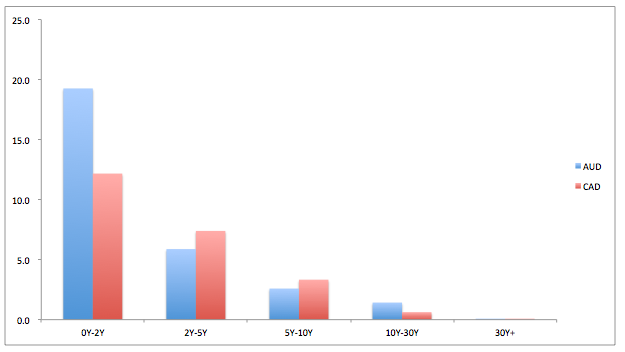
While a chart for AUD and CAD, shows an even greater dominance of volume below 5Y. This could either be a characteristic of the Swap markets in these currencies or the fact that less of the overall market in longer tenors is cleared as opposed to uncleared.
EUR Swaps vs Bond Futures
Another illustrative comparison is to compare EUR IRS volumes by tenor with Eurex Bond Futures volumes.
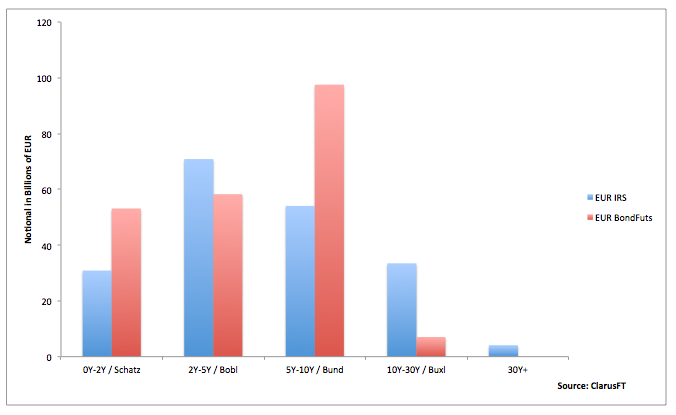
(While the Schatz contract is 1.75-2.25Y, Bobl 4.5Y-5.5Y, Bund 8.5Y-10.5Y, Buxl 24Y-35Y, we can approximately compare the May volumes with the same tenor buckets that we have already used).
Showing that in May 2018, the ADV is similar for the first two tenor buckets, higher for the Bund vs 5Y-10Y and lower for the Buxl vs 10Y-30Y. (Note for the Futures, we have calculated notional as number of contracts traded in the month * contract size / days in the month).
A better comparison would be to use DV01, but time and my Excel skills are against me here, so that is a task for another day.
Overall we see €193 billion in EUR IRS vs €216 billion in these Bond Futures, pretty close.
While Open Interest in these four contracts at Eurex on May 31, 2018 is €634 billion notional, compared to €22 trillion in EUR IRS at LCH SwapClear. However these numbers are less comparable due to the fungible nature of futures positions as compared to swap trades. Futures position net down to zero for the same contract and delivery month, while Swaps are often left with offsetting notionals in similar maturity dates, even with the regular and massive compression activity.
There is lots more data to look at.
Thats It
But thats all I have time for today.
Thank you for reading this far.