- We use SDR USD OIS Volume and Price data to derive a new Fed Pulse Index
- The index construction takes all FOMC meeting-dated OIS that are traded across the yield curve
- This allows us to make maximum use of all price and volume data embedded within OIS trades
- Allowing us to “take the pulse” of the FOMC at any moment in time
- We then see extreme Index values that coincide with the level of market surprise. The end result looks like this:
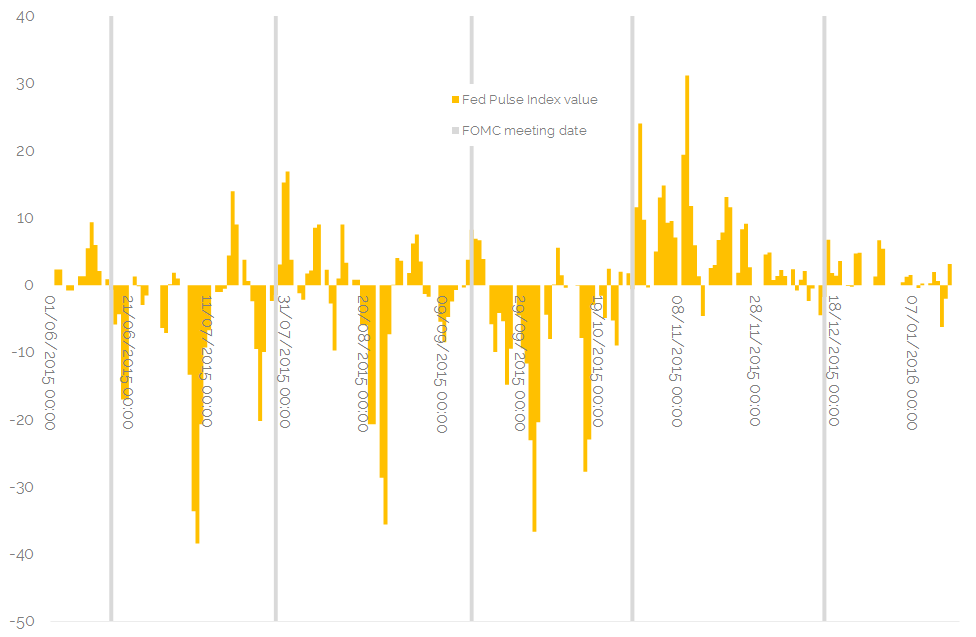
A Conviction-Weighted Index
Our new Clarus Fed Pulse Index combines the change in Volume Weighted Average Prices across FOMC meeting-dated OIS trades. These VWAP deltas (Δs) are “conviction” weighted when making up the Index. We use the last 10 trades because using activity rather than an arbitrary time-period is more in-keeping with the goals of the Index.
The Fed Pulse Index is constructed as follows:
- Calculate the Volume Weighted Average Price for the last 10 FOMC-dated OIS trades
- Take the change in VWAP between each specific FOMC trade and the next (ΔVWAPs)
- Conviction-weight the ΔVWAPs, using the trade volume
This gives us an Index that is:
- Timely. The Index value can be recalculated every time a new trade hits the SDR.
- Conviction-weighted. Larger trades carry more weight in the Index. Large trades with large price impacts carry the most weight.
- Concise. We combine both Volume and Price data into a single meaningful measure.
A Bit of Background
Drivers to price change in any market can be considered fundamental, price-related and/or position-related. I’ve set out to design an Index that can monitor these three areas for all FOMC-related OIS trades that are reported to the SDRs.
Why FOMC-related? The reasons are three-fold:
- They give a precise view of the market expectations as to the timing of any rate changes.
- They give a precise view of the market expectations as to the size of any rate changes.
- Because they are OIS-based, they are less impacted by supply and demand factors affecting the basis – something that Libor-based trades can be subject to.
As I noted in the first two blogs in this series, the search for such an index has been far from straight-forward. We first looked at Volumes in isolation of price. The theory being that more people trade when the Fed “surprises” the market – so we tested whether Volumes are a good predictor (or indicator) of the amount of “surprise” in the market activity.
Despite using a few different cuts of the data, we concluded that we also need to include price information. Just as it makes no sense to throw away the volume data, it equally makes no sense to throw away the price data! So we had a look at the VWAPs for FOMC-dated OIS trades, to see how Price evolved hand-in-hand with volumes.
We found that volumes seemed to increase when price moves were at their largest (or “most volatile” if you prefer). This is hardly surprising, but it’s an important input into the design of the subsequent Index. However, we found that purely looking at VWAPs didn’t necessarily give us the required predictive properties that we would like – in simple terms, the VWAP evolution didn’t seem to “jive” with the market commentary surrounding Fed decisions last year.
Timely Data
When I looked at the VWAP data, I was looking for trends. Essentially I was looking at the change in VWAP from one period to the next. Therefore, rather than look at VWAPs, why not look at the VWAP change instead (ΔVWAP)? This got me a long way towards the final iteration, with a couple of outstanding questions.
A Pulse Index
Overall, what I wanted seemed fairly simple and intuitive to me:
- An Index that uses the maximum amount of data regarding Price and Volume
- An Index that makes sense when considering both changes in market expectation of timing and size of rate hikes (I consider it just as important if an expected rate hike gets delayed/ accelerated as I consider a change in the level of rates)
- An Index that makes sense in “real-time”. I don’t want a daily Index that ends up being less timely than the actual trade data.
I therefore plotted the ΔVWAPs for a particular FOMC-dated OIS. This allowed the Index to apply equal weights to both curve trades and outright trades, but give little-to-no weight to trades written at mid-market. I ended up with the following “Pulse” pattern of ΔVWAPs for the September FOMC meeting:
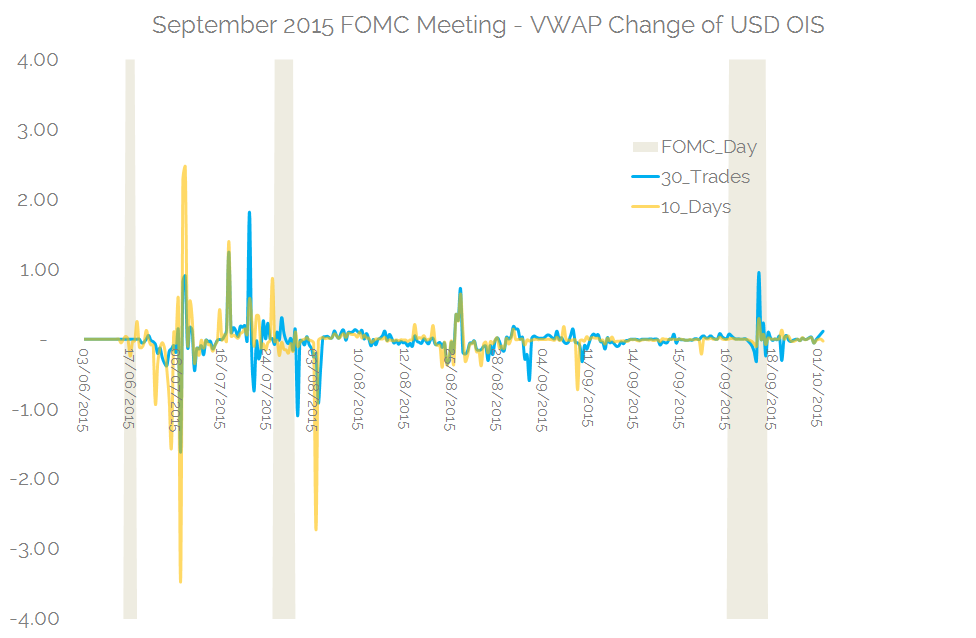
Showing;
- The change in VWAP (ΔVWAP) between consecutive OIS trades related to the September 2015 FOMC meeting…
- with the VWAP calculated either over the last 30 trades (blue line)…
- …or the VWAP calculated over the last 10 days (orange line)
- The different periodicity of each line paints a similar picture, with the longer time line (30 trades in this instance) resulting in lower peaks and troughs
The issue I had with this was trying to interpret what those peaks and troughs meant – and what a “significant” reading was for any given periodicity. We’re also only looking at one meeting date here (the September FOMC), but the intention for the Index was to combine a number of meeting dates together (September 2015 FOMC through to April 2016 FOMC in our data sample).
A Conviction-Weighted Index
Therefore, I decided to volume-weight the ΔVWAPs. This means that large trades with big price moves carry a larger weight in the Index. In simple terms, putting a large amount of capital to work without regard to price conveys a high conviction strategy.
I also decided to use the past 10 trades because using activity rather than an arbitrary time-line is more in-keeping with the goals of a conviction-based Index.
Clarus Fed Pulse Index
In summary, the Fed Pulse Index is constructed according to the following guidelines:
- Calculate the Volume Weighted Average Price (VWAP) for each FOMC-dated OIS trade for the last ten trades.
- Look at the change in VWAP between one trade and the next (denoted ΔVWAP) .
- Sum up all of the changes in VWAP, weighted by the volume of the trade.
- Construct the Index for the chosen periodicity (I chose two days below).
This gives us an Index that is Timely, Conviction-weighted and Concise.
Take a look at the following chart of the Clarus Fed Pulse Index versus January 2016 FOMC Price. The chart is pretty compelling;
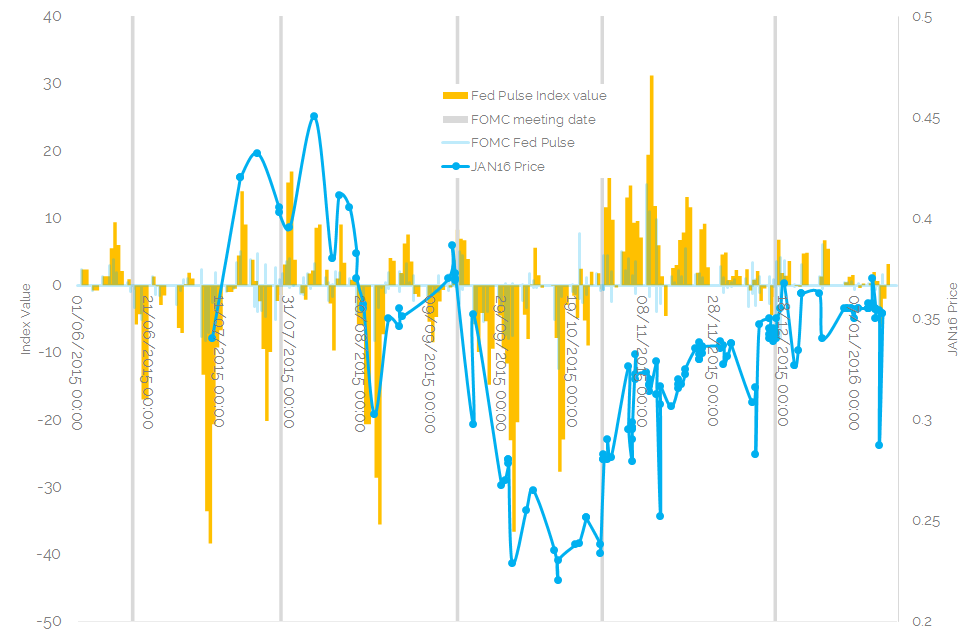
Showing;
- The price of the January 2016 FOMC started and ended at similar levels during our observation period (June 2015 – today).
- The moves higher in price typically started when the Index reached extreme values that were less than -30. These moves were fairly aggressive at the start, suggesting position re-adjustments were the cause. This is consistent with a market that had gotten too dovish – and had put on too many aggressive trades that were in large size and had caused a move lower in price.
- The moves lower in price that we saw were not so position-related. As a result, the reversals lower were less sharp and not associated with extreme values of the Index.
Explaining this meeting-by-meeting, we can show that:
- Headed into the July 2015 FOMC, the market was somewhat dovish leaning (an Index value of -20 beforehand). The meeting was considered a hawkish nod towards a possible September hike and hence we saw some position readjustments leading to a higher price and a higher index value.
- The August volatility and general global-markets turmoil led to a big shift in expectations and hence extreme negative Index readings. The moves lower were exacerbated by the hawkish positions put on after the July FOMC meeting.
- However, before the September FOMC, much of this dovish-bias was reversed in the market, such that market-bias was close to neutral going into the meeting. This is consistent with market pricing going into the meeting and the market outcome.
- Going into the October meeting, the market built up a surprisingly dovish-bias, with some extreme negative Index readings. With the Fed signalling a December lift-off, we saw the most positive readings on our Index and a clear pricing-in for the December meeting. Hence we saw a sharp move higher in price (associated with repositioning) and a shift to positive Index readings.
- Before the well-telegraphed lift-off in December, despite volumes in OIS being generally high, it is clear that Index values were far from extremes and that the rate hike was well anticipated by the market.
In Summary
We create a conviction-weighted Fed Pulse Index.
This measures market expectations of rate moves going into an FOMC meeting.
We combine both Price and Volume data to measure the Dovish or Hawkish-bias in the market.
As a result, our Fed Pulse Index anticipates sharp price reversals, as the effect of repositioning is felt on prices….
…further aiding price transparency in OTC markets.
Could be nice to have a unit for the vertical axis. Being no expert, it’s not obvious to me.
Et voilà, tried to fix that for you. Units of the Index would effectively be Volume in Millions multiplied by price change in basis points. JAN16 FOMC price also shown on the chart now.