- The average maturity of USD OIS swaps has reduced significantly in recent months.
- OIS swaps now make up almost 20% of all traded risk in USD swaps, up from less than 5% in 2014.
- As a result of increasing volumes in OIS and their very short maturity, a significant reduction in overall average maturity is being seen across all USD swap products.
- This could be due to a number of factors, including an exit from ZIRP in the US.
Hypothesis
We start with a simple hypothesis today. In a ZIRP-world, market participants are forced to extend their swap maturities for two reasons:
- In a search for yield to (hopefully) result in real positive returns over inflation
- In a search for volatility as short-end rates are pegged by the central bank
This effect has been crystallised ever since the financial crisis with curves “bull-flattening” across Fixed Income.
Cue Fed Rate hikes. Has this change in monetary policy changed either of these behaviours over the previous fifteen months? Of course, it will be impossible to dislocate the effects of a (potential) shift in fiscal policy affecting long-term interest rates in the US as well. However, with that caveat in place, let’s take a look at the data.
The Data
I had no idea when I set out to test this hypothesis how easy (or hard!) it would be to get the SDR-related data. I essentially needed to run a query on all USD Interest Rate Swaps that;
- Ran the query by a time-period – ideally monthly.
- Split the results by tenor of the underlying trades.
- Summed the results within each vertex of the matrix by Notional.
- Allowed me to easily convert Notional to DV01 and back again.
- Run a meaningful time period – ideally since January 2014.
You may or may not be surprised to read that SDRView Res does this in a single call – either from our API or GUI:
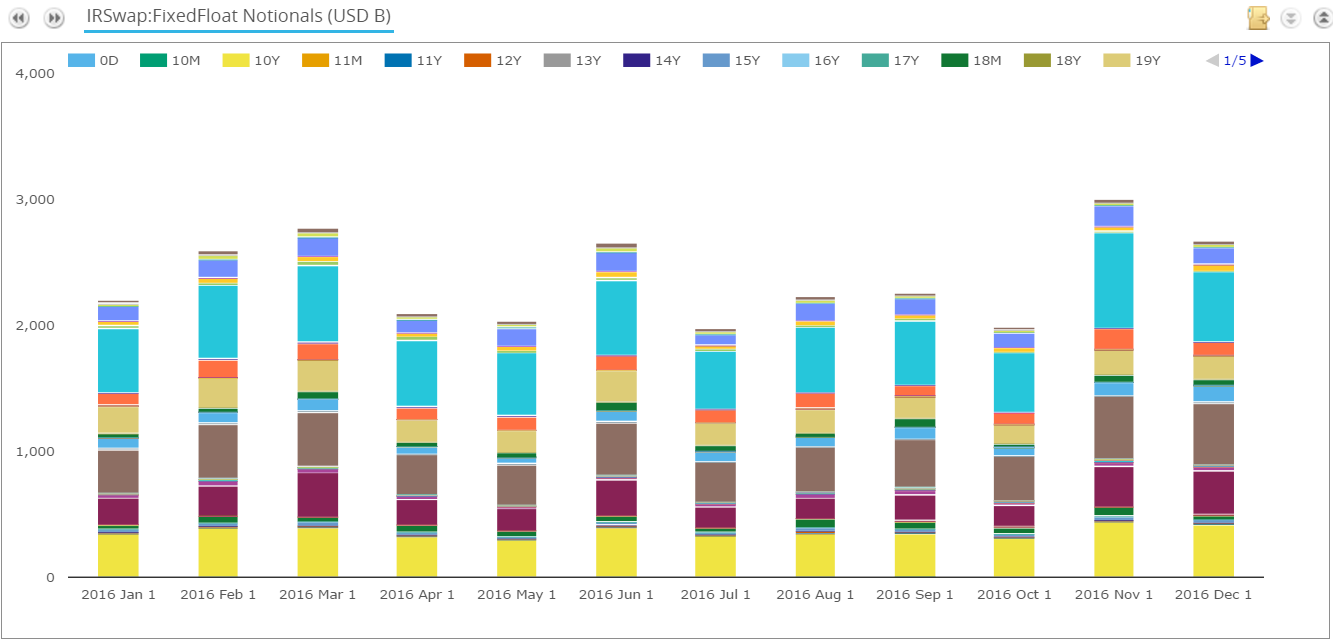
Showing;
- USD Swap Notional traded each month during 2016. One (easy) tick.
- The results are split by tenor. Another (much harder) tick.
- These results are exportable to Excel (as a .csv) giving me a matrix output such as the below:
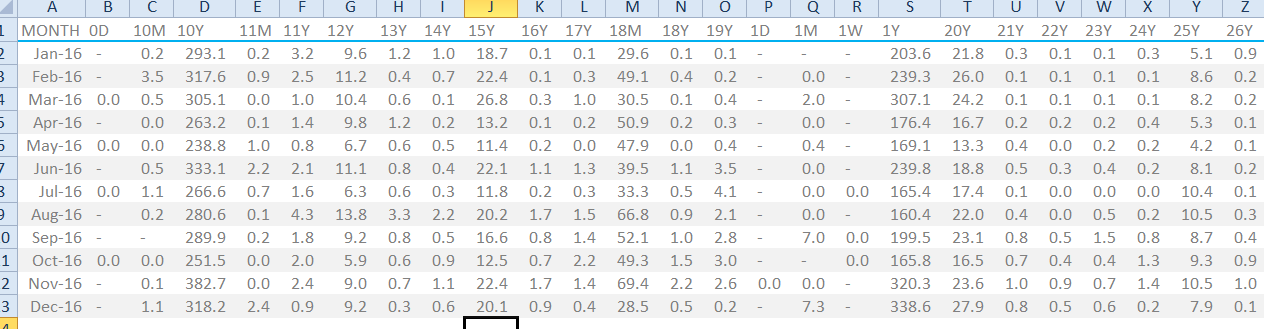
- Finally, the query runs both Notional and DV01 amounts since 2014. Result!
USD Libor Swap Data
I’ve summarised each month’s data into a single data point – the weighted average maturity (in months) of all USD Fixed-Float swaps. I excluded all back-starting swaps from the analysis as the tenor designation is a little bit of a misnomer for these products.
Armed with a clean data-set, we see the following trend in average tenor traded:
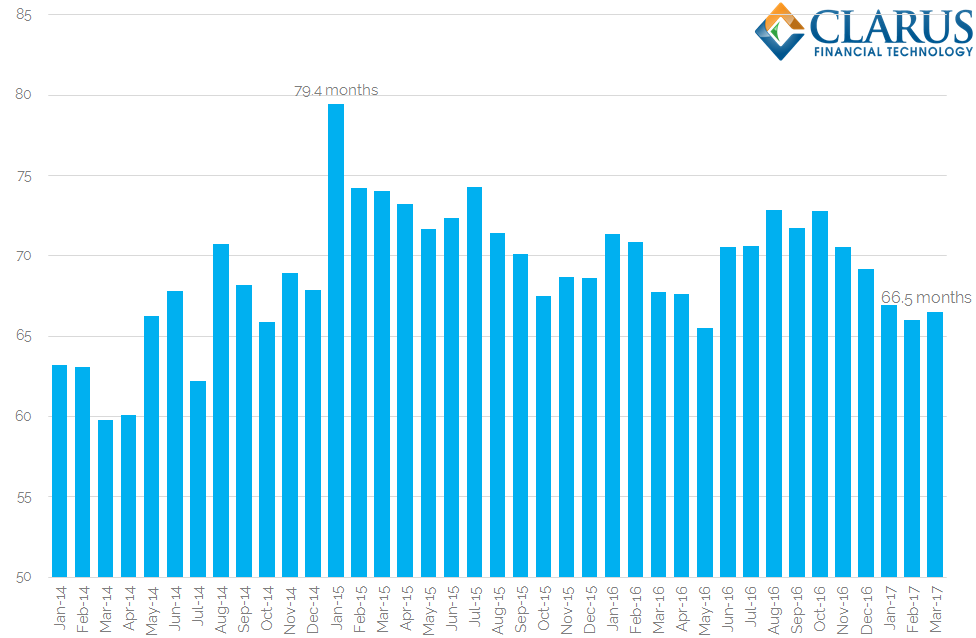
Showing;
- In March 2017, the weighted average maturity of USD swaps was 66.5 months (just over 5 and a half years).
- The longest average maturity we saw was back in January 2015, at nearly 80 months (6.6 years).
- The shortest average maturity was toward the beginning of our time series, in March 2014, at just less than 60 months (<5 years).
- The sample data is fairly striking in its conformity. There is less than 2 years difference in average maturity between a “long duration” month and a “short duration” month.
- However, since the peak in January 2015, average maturity has been trending somewhat lower each month.
USD OIS Data
One of the themes of our recent Swap Reviews has been the ever-increasing volumes we see in OIS swaps – particularly in USD. Are these impacting the average maturity in the market? It’s a valid supposition, so let’s add USD OIS swaps into our data mix and see.
First, USD OIS as a standalone product:
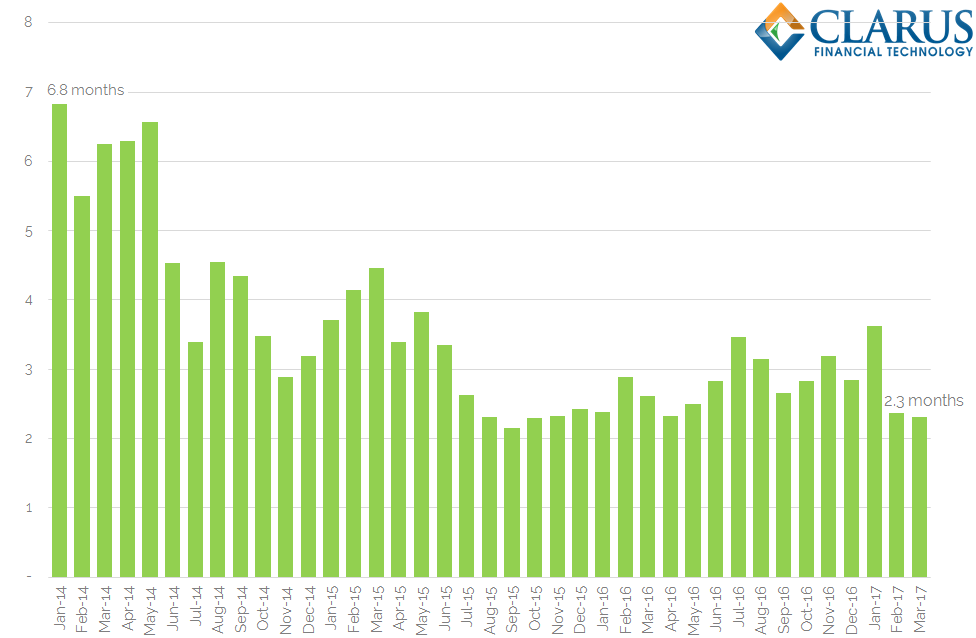
Showing;
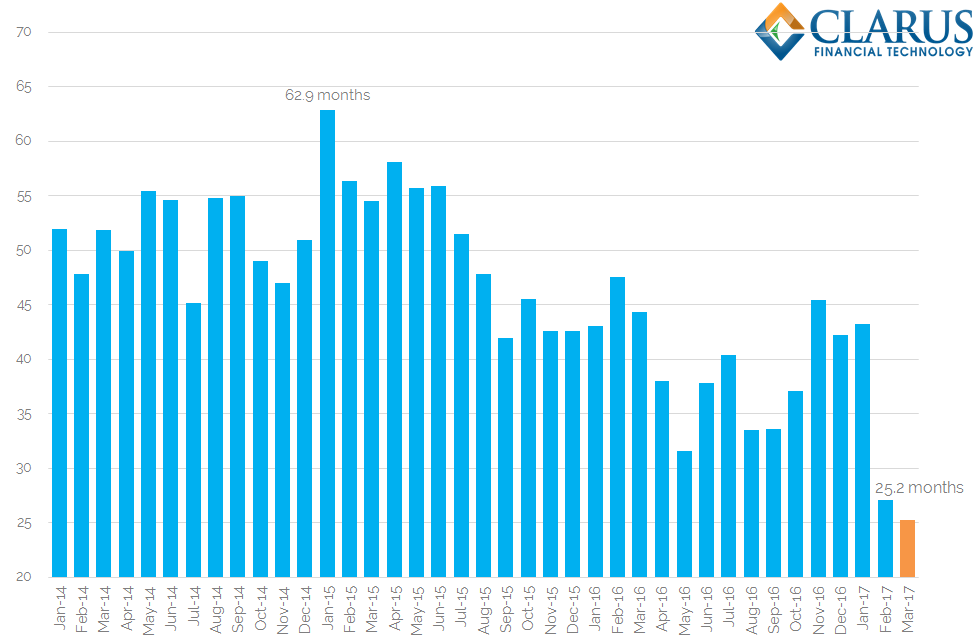
- A very clear trend from an average maturity of nearly 7 months in January 2014 to around 2.25 months in March 2017.
- We are not quite at the shortest maturities recorded currently, but average maturity in the OIS markets has very clearly reduced.
What therefore happens when we combine the two data-sets?
- Average maturity across both OIS and USD swaps is at an all-time low since reporting began.
- Remember that we do not see this trend in Libor-based USD swaps only.
- It is the combination of OIS and Libor swaps that causes our average maturity to plummet. It is now around half of what it was during 2014, at just over two years.
- This is a combination of both increasing volumes in USD OIS coupled with a shortening of average maturity across all products.
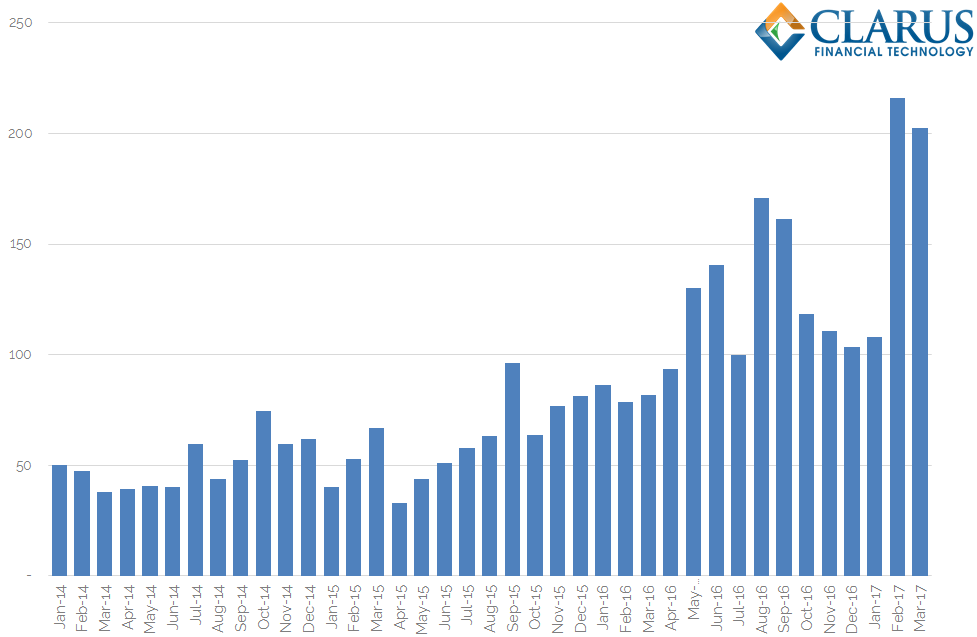
On that last point, it is worth noting that the total amount of risk traded in OIS products has increased significantly. OIS trades are getting shorter, but notional volumes are increasing at a much faster rate. This is shown in the chart below:
Showing;
- Total risk in DV01 terms traded in OIS swaps has increased 4-fold since 2014. (Please note that the calculations assume a constant DV01 using today’s curves. This has a very limited impact on the analysis).
- OIS swaps are therefore a far more significant market now than back in 2014.
- OIS swaps therefore have a far more significant impact on the overall average maturity in the market.
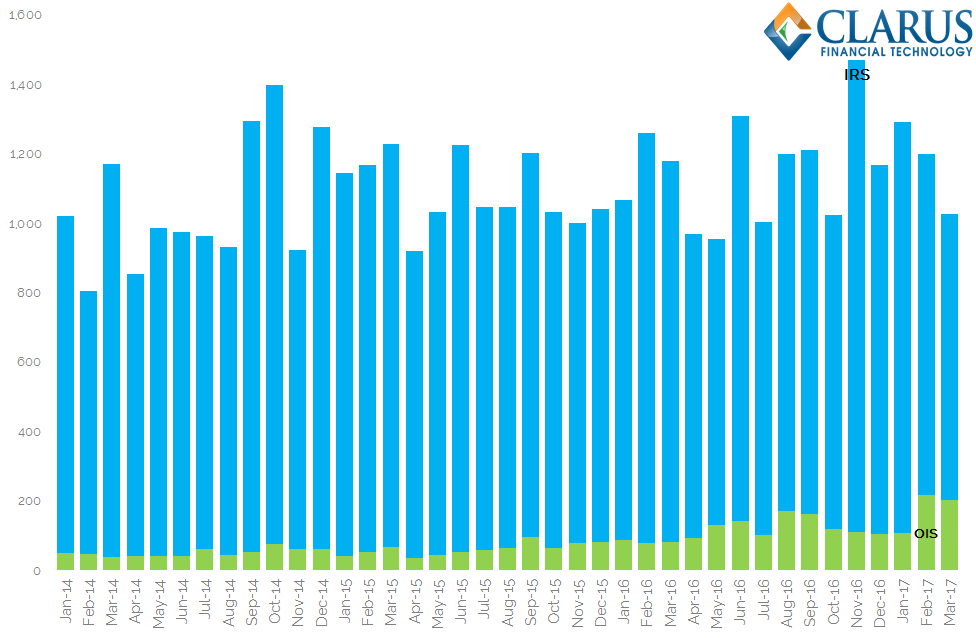
- The chart above shows how the product mix has altered significantly in the past 3 years.
- On a DV01 basis, the share of OIS trading has increased from less than 5% in 2014 to 20% this month so far.
Risk Analysis
One aspect of this analysis that concerned me was that of verifying the total amount of risk traded versus the average maturity. Remember that a simple count of the number of months in a trade is a linear calculation, whilst DV01 (i.e. the risk) is not. At each step, I have therefore verified that the total notional, multiplied by the DV01 of the calculated average maturity is always roughly equal to the total DV01 traded. This applies to both OIS and Libor swaps.
The natural next step for this analysis is to measure the average maturity on a DV01-weighted basis. We looked at this average duration back in January 2017 for SEF markets here. We have some more investigation to do when combining the figures across IRS, OIS and even FRA markets. Watch this space.
Final Thoughts
There is, of course, a fairly likely base to find here. How short can the average maturity go? It is very unlikely that all accounts will start trading 1 month Fed dates instead of ten-year swaps.
What I find more interesting is that we have never had this level of transparency during a monetary policy change before.
It therefore seems crazy not to use this hard-won transparency to monitor as many behaviours as possible across our markets.