As we get close to year end, it is time to assess the trends in volumes that we have seen in 2019. Usually we do this by looking at the cleared volume in a period (month/quarter) compared to an earlier period, or the open interest (outstanding notional) at a point in time. Today I will also use “change in open interest”, a fairly common metric in Futures, but one that we, as Swap centric types, are not used to focusing on.
Money Market Futures
Using CCPView we look at quarterly volumes of money market futures contracts in 5 major currencies:
- USD – CME Eurodollar, FedFunds, SOFR Futures
- EUR – ICE Euribor Futures
- GBP – ICE Sterling and Sonia Futures
- AUD – ASX Bank Bill and Cash Rate Futures
- JPY – TFX Euroyen Futures
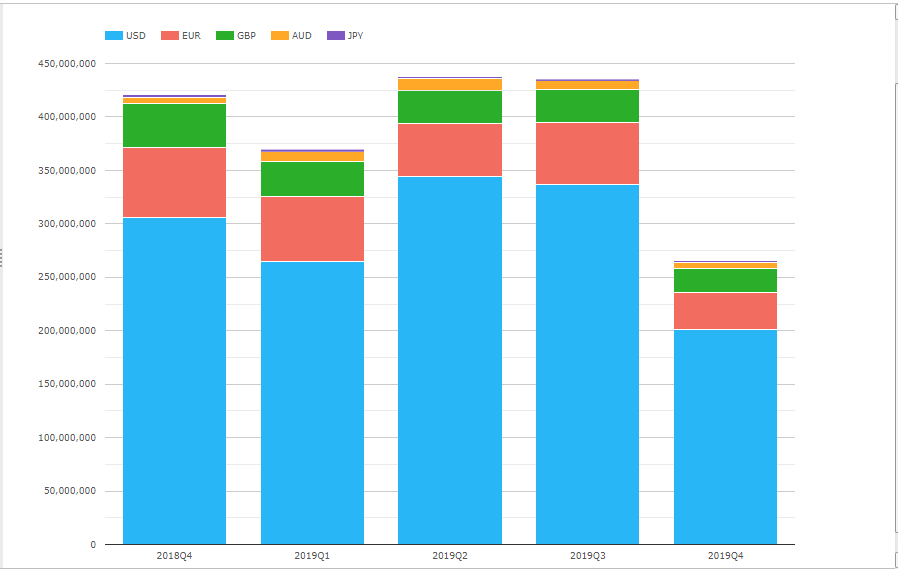
Our data for 4Q2019 is only up to December 13, 2019, not only leaving 11 business days to go to in the quarter but also with IMM rolls to come on December 17, 2019 (which result in massive volume). So we should not draw any conclusions yet on the current quarter vs prior quarters.
What we can note is:
- Volume in USD contracts is by far the largest, with a high of $340 trillion in 2Q 2019
- EUR with a high of $65 trillion in 4Q 2018
- GBP a high of $41.5 trillion in 4Q 2018
- AUD a high of $10.8 trillion in 2Q 2019
- JPY a high of $2.5 trillion in 1Q 2019
While such mind-boggling large numbers are a good measure of the volume of trading activity in the interest rate contracts in these currencies (excluding bond futures) , as a lot of trading positions are opened and closed intra-day, we need to look at Open interest to get a sense of how much risk is on.
MM Futures – Open Interest
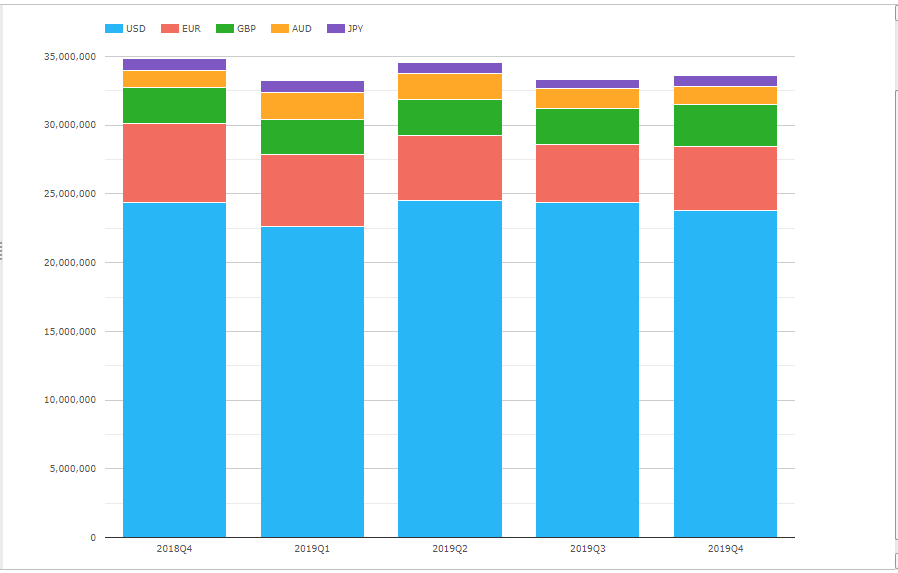
Showing the open interest by currency at the end of each quarter, except for 4Q 2019, which is as of December 13, 2019. In numbers:
- USD $24 trillion
- EUR $4.7 trillion
- GBP $3 trillion
- AUD $1.3 trillion
- JPY $0.8 trillion
Even more interesting is the change in OI over each quarter, a metric that we have recently added to CCPView. An increase in OI signifies a risk-on or bullish quarter, while a decrease signified a risk-off or bearish quarter.
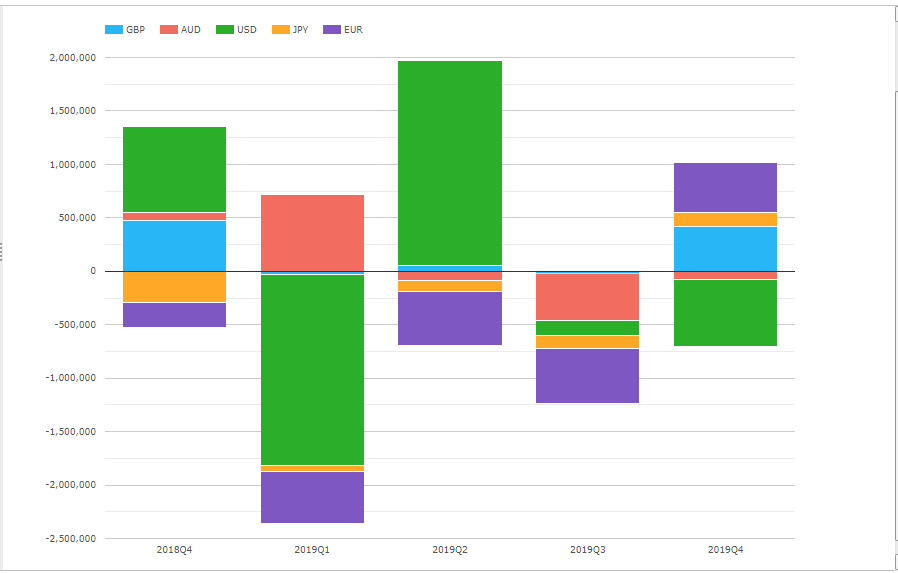
Showing:
- USD, a large drop in OI (risk off) in 1Q 2019, $1.8 trillion compared to the $24.4 trillion at the start and a large increase in OI in 2Q 2019 of $1.9 trillion, while 4Q 2019 is heading for a significant drop.
- AUD prominent with a large increase of $700 billion in 1Q 2019 and a drop of $400 billion in 3Q 2019
- GBP with large increases in 4Q 2018 and 4Q 2019
- EUR with decreases in each quarter, except for 4Q 2019
- JPY also with decreases in each quarter, except for 4Q 2019
Certainly different and interesting trends by quarter for each currency.
Interest Rate Swaps
Let’s now present the same charts for Swaps, selecting the two major types, IRS and OIS, so excluding FRAs, Basis, VNS, ZC, Inflation and using the CCPs, ASX, CME, JSCC and LCH; starting with volume (single-sided).
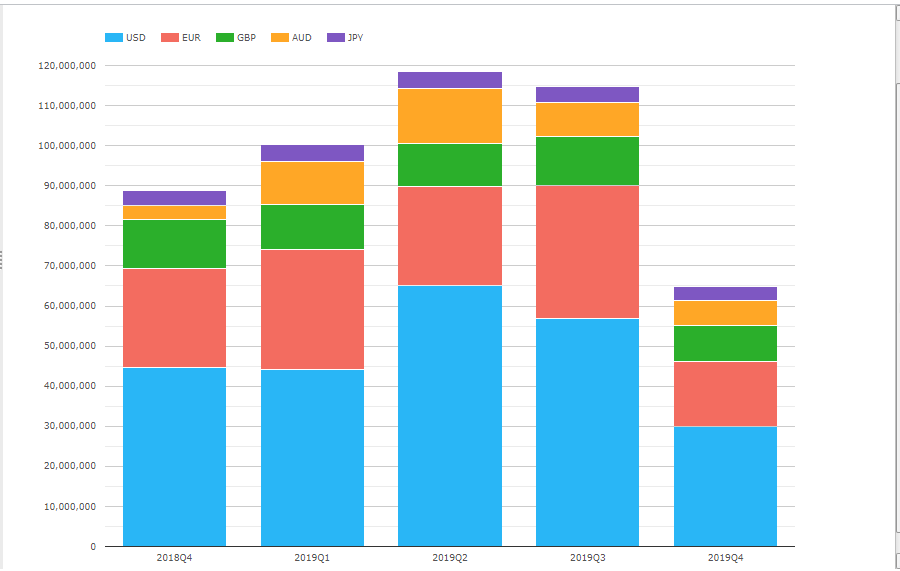
Again caveats apply to 4Q 2019 as we have 11 business days to complete the quarter and while IMM roll volume is not a massive effect as it is in Futures, there will certainly be some Swaps roll activity linked to Futures and year-end specific volume too, so the jury is out on the current quarter.
Volume in USD is the largest, but the relative magnitude to the next largest currency EUR, is much less than that we see in Futures:
- USD, a high of $65 trillion in 2Q 2019, compared to $340 trillion in Futures, a ratio of 1 to 5.
- EUR a high of $33.4 trillion in 3Q 2019, compared to $58.5 trillion in Futures, a ratio of 1 to 1.75.
- GBP a high of $12.2 trillion in 3Q 2019, a ratio of 1 to 2.5 to Futures.
- AUD a high of $14 trillion in 2Q 2019, a ratio of 1 to 0.75 to Futures
- JPY a high of $4.2 trillion in 1Q 2019, a ratio of 1 to 0.6 to Futures
Interesting how the relative volume of trading in Swaps and Futures differs in each currency.
IR Swaps – Open Interest
Lets now turn to open interest or outstanding notional (single-sided).
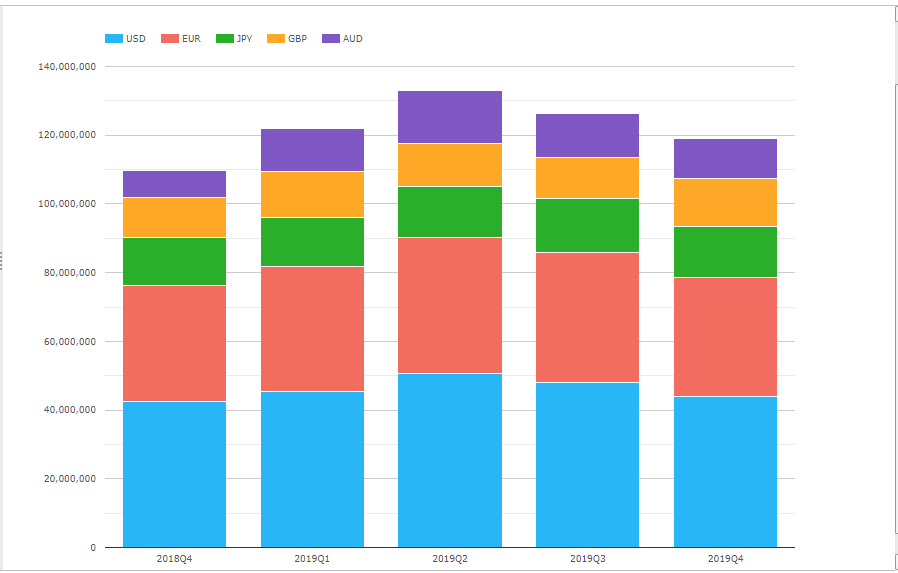
Showing the open interest by currency at the end of each quarter, except for 4Q 2019, which is as of December 13, 2019. In numbers:
- USD $44 trillion, a ratio of 1.8 to 1 to MM Futures
- EUR $35 trillion, a ratio of 7 to 1
- GBP $13.8 trillion, a ratio of 4.5 to 1
- AUD $11.6 trillion, a ratio of 9 to 1
- JPY $15.5 trillion, a ratio of 19 to 1
Confirming that OI is much higher in Swaps than Futures, while the opposite is true for Volume.
IR Swaps – Change in OI
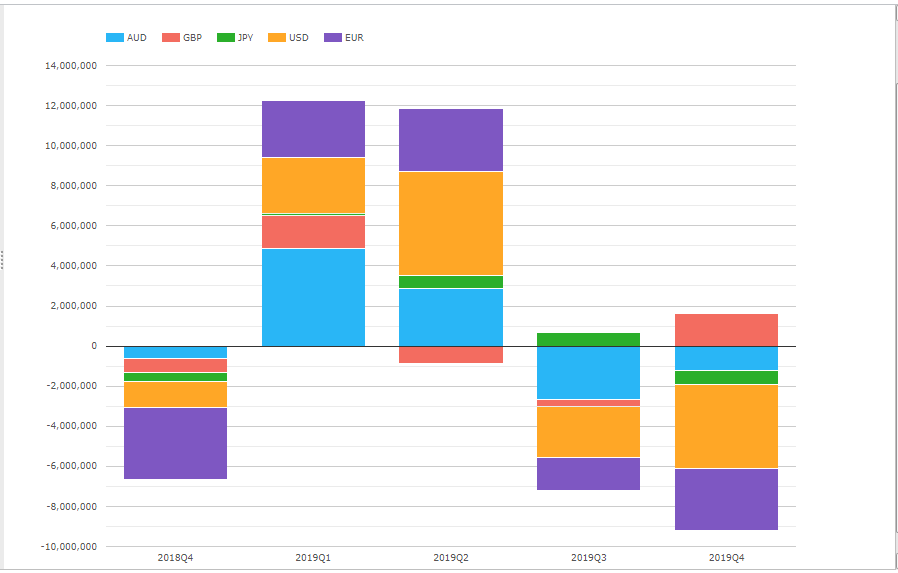
Showing:
- USD with a large increase of $5.2 trillion in 2Q 2019, similar to the Futures increase of $1.9 trillion in this quarter, but 4Q 208 and 1Q 2019 with diametrically opposite changes in OI
- AUD with a large increase of $4.9 trillion in 1Q 2019 and a drop of $2.7 trillion in 3Q 2019, similar to Futures
- GBP with increases in 1Q 2019 and 4Q 2019
- EUR with decreases in each quarter, except for 1Q 2019 and 2Q 2019, very different to Futures
The change in Open Interest for Swaps is not as clean a measure as that for Futures, because it results not only from new trade volume over the period but also the stock of trades that mature in the period and even larger the notional that is unwound/reduced by compression services offered by TriReduce, the CCP or other service providers. (See compression in swaps).
By subtracting Volume from the OI Change, we can get an insight into this, a metric that we have recently introduced in CCPView.
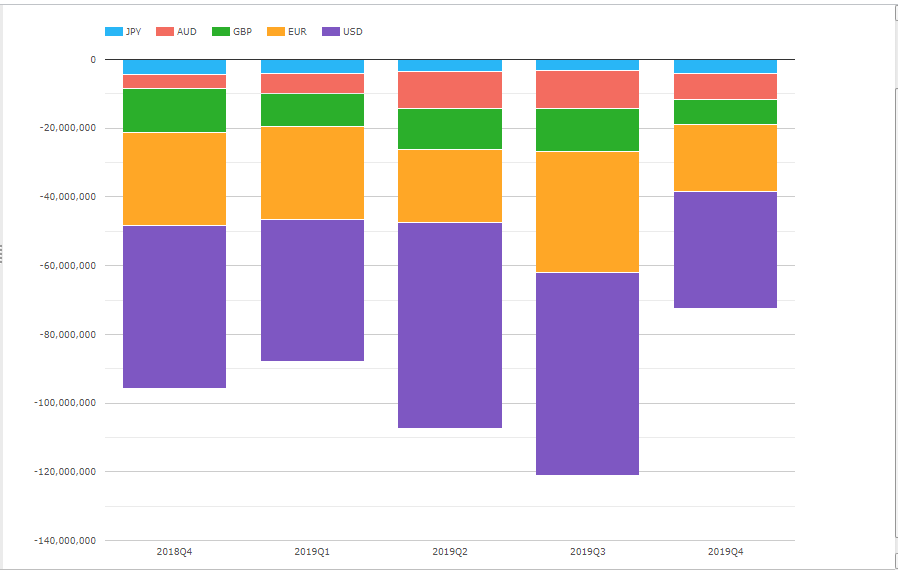
Showing the very large amounts of notional reduction from compression and maturing trades in each currency, with a high of $120 trillion in 3Q 2019.
Large numbers indeed.
That’s all I have time for today.
Summary
CCPView has lots of interesting data.
Volume, Open Interest and now Change in OI.
Which we can aggregate to show trends over periods.
As I have done above.
Or at many different filter and aggregation levels.
Please reach out to us if you are interested in using this data.