- We look at the growth in cleared volumes across FX products.
- NDFs now see over $1Trn cleared in a single month.
- Open Interest has grown significantly in the past two years.
- NDFs in 8 currency pairs dominate cleared OTC volumes.
For those interested in uncleared markets, and particularly FX, it may be interesting to know that the latest BIS Triennial Survey is a matter of months away:
One of (many) elements that we will look at in the data is whether the uptake of FX clearing has accelerated/plateaued/plummeted. Let’s take a look at the data we have from Clarus products to see if we can shed any light on this in a more timely manner.
FX Cleared Volumes
Using CCPView, we see that cleared FX volumes have grown considerably since we last wrote about them way back in 2019:
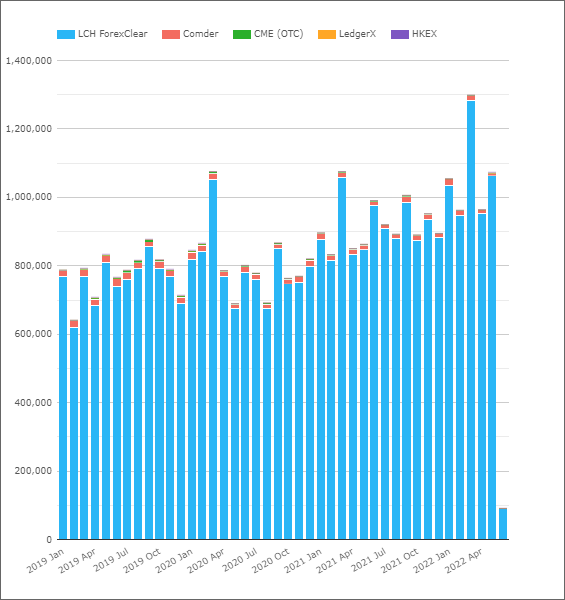
Showing;
- Peak cleared FX volumes now surpass $1Trn in a large volume month.
- March of 2020, 2021 and 2022 have all recorded successive all time highs in volumes. That is a weirdly regular pattern with March being a key month.
- Is this related to new phases of Uncleared Margin Rules coming live? I thought those were in September each year….?
- LCH ForexClear continues to have 98%+ market share in FX OTC clearing.
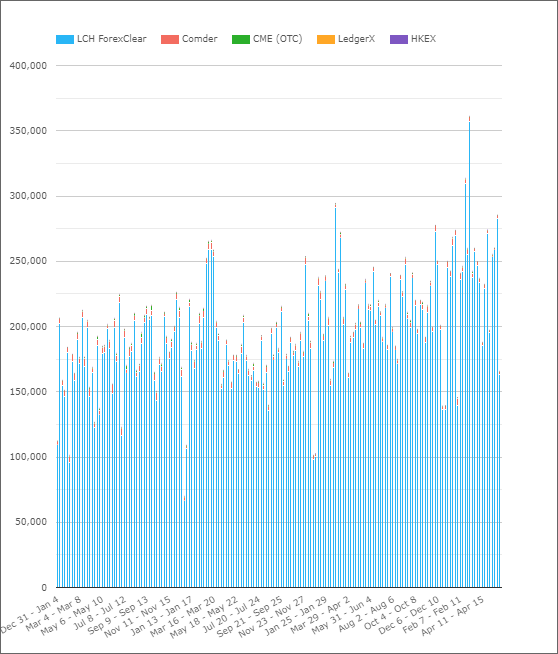
- The weekly volume chart below (of the same data) does not suggest that there is any unusual activity (such as compression volumes showing up) in any particular week. Those March peaks sure are unusual in the monthly data though:
Are These Still All NDFs?
In a word, Yes!
Drilling-down into the record month, March 2022, shows the product types being cleared in FX:
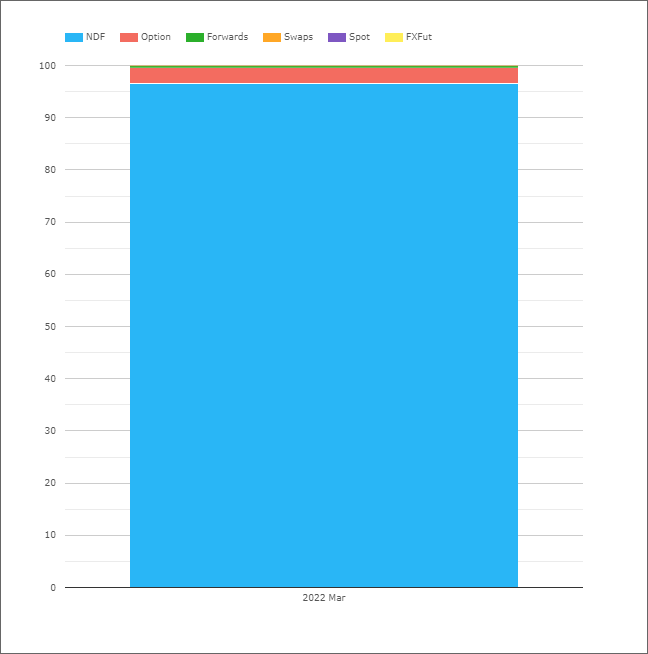
The key message here is that 96%+ of cleared FX volumes are in NDFs.
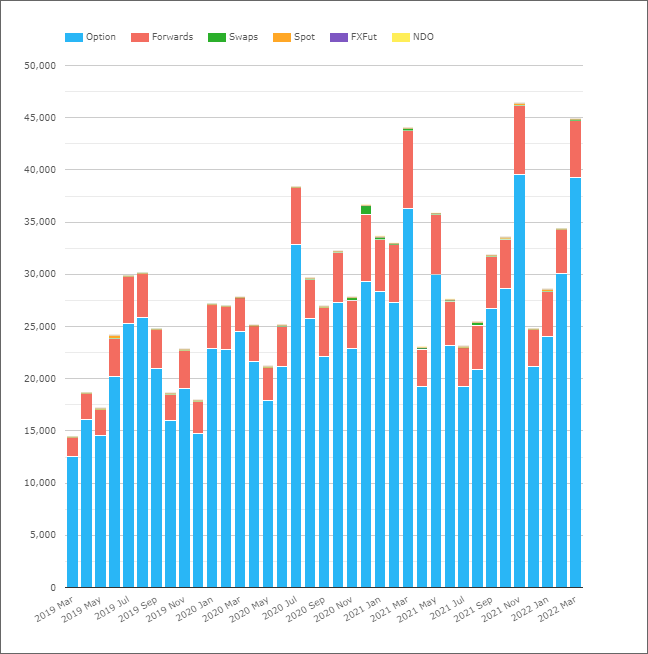
Followers of the blog will know it has been quite a story to get this far in the clearing of NDFs, so we should also acknowledge that there has been some volume growth in other FX products, but they are not yet significant compared to the growth in NDFs:
Which NDF Currency Pairs are the largest?
The same data for March 2022, but this time split by currency pair, shows:
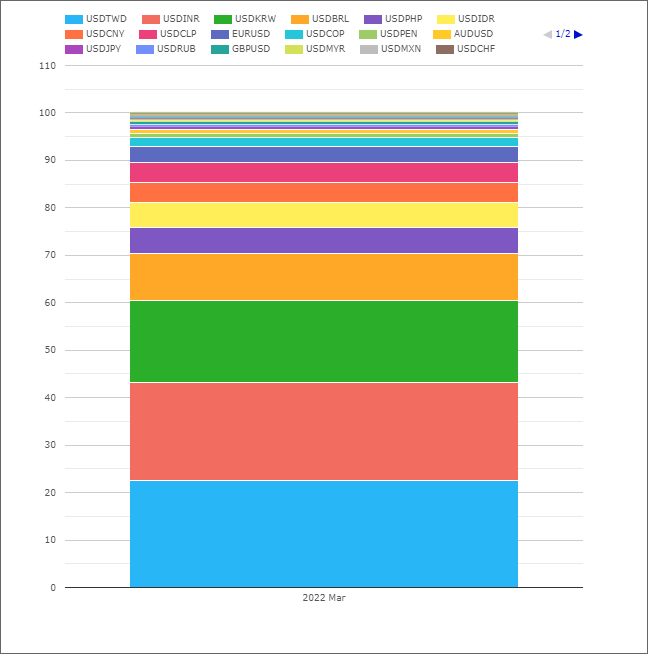
- 22% of volume in in TWD
- 21% is in INR
- 17% in KRW
- 10% in BRL
- 5% each in PHP and IDR
- 4% each in CNY and CLP
- 88% of total volumes are in these 8 currency pairs.
To put non-NDF FX clearing into perspective, all of the other product types accounted for about the same amount of volume as USDCLP NDF clearing in March 2022.
NDF Clearing Rates
We can use the CFTC weekly Swaps Report to monitor how much of the NDF market is now cleared. Given the large increase in volumes over the past 2-3 years, do we see a significant increase in Clearing rates?
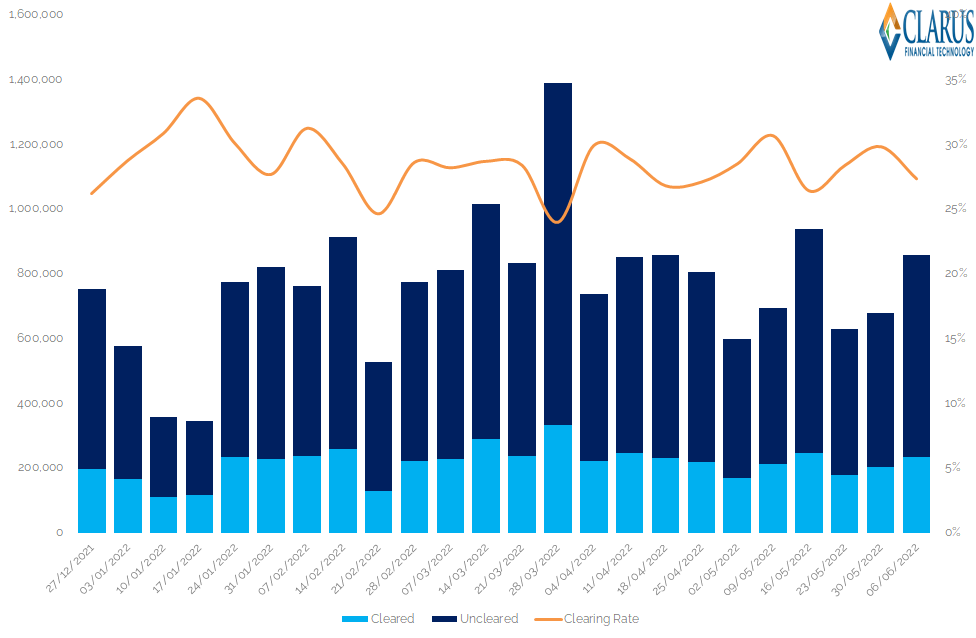
- Weekly traded USD notional equivalents as reported in the CFTC swaps report for FX product type “NDF”.
- These reconcile very well with our own CCPView data, as we reported on last time.
- In September 2019, I wrote:
A marked increase in cleared NDFs from the middle of July 2019.
The most recent data shows the highest clearing rates, reaching 29%
NDF CLEARING SEPTEMBER 2019
And what do we see now?
- A very stable Clearing Rate during 2022.
- 28% of NDF volume has been cleared in 2022 according to the CFTC data.
- This has varied from as low as 24% and up to 34%.
- The chart shows that the highest clearing rate was achieved in the lowest volume week.
- The contra is true as well – the lowest clearing rate was achieved in the highest volume week.
- Clearing Rates were roughly constant through the market turmoil in February, but remember that USDRUB volumes barely register compared to the 8 largest currencies.
And What About FX Futures?
With OTC FX Cleared volumes over $1Trn now, is there still room for FX Futures? CCPView shows that exchange traded FX derivatives are also a significant market, with over $3Trn in USD equivalents traded in a busy month:
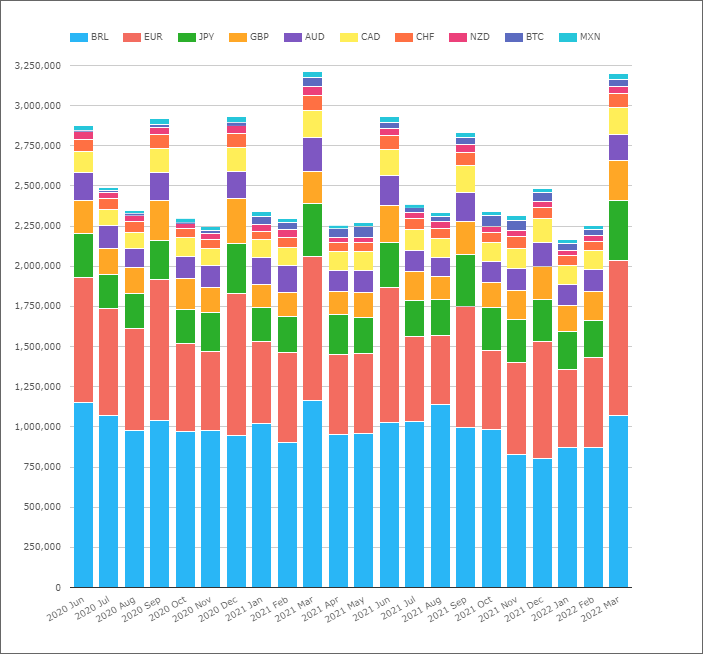
These products are mainly FX Futures traded at CME, and the BRL FX Future traded at B3 (which I think CME also owns a stake in?).
However, comparing volumes across OTC and ETD is notoriously difficult. Rather, if we compare the relative size of Open Interest across the two, we see that cleared NDFs are the far more significant market:
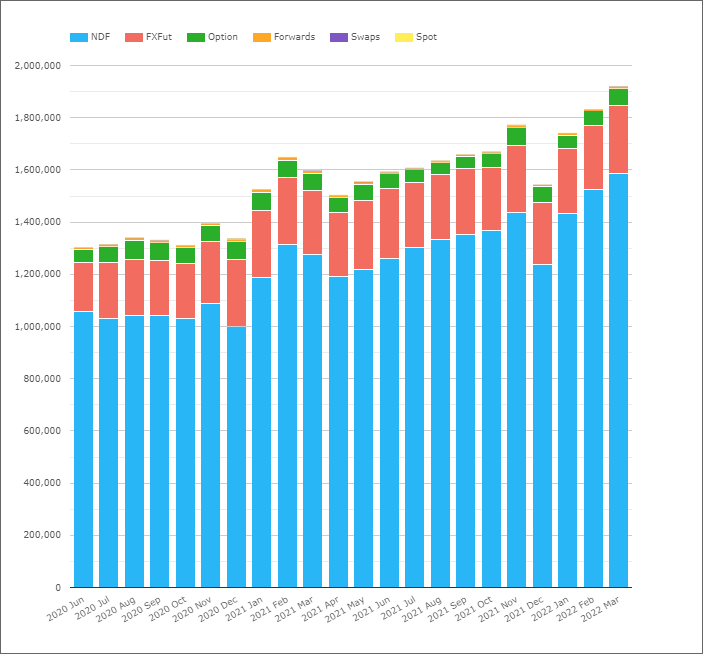
Showing;
- Over 80% of the Open Interest in Cleared FX products is in NDFs.
- NDFs have a relatively short average maturity – let’s say one month.
- I guess most FX Futures are even shorter and are likely traded as a proxy to hedge spot risk.
- Interesting to see that Open Interest across all of these products is some 45% higher now than two years ago. Will the growth continue?
In Summary
- Monthly volumes in cleared OTC FX products now surpass $1Trn.
- 96% of these volumes are in cleared NDFs.
- 8 currency pairs make up almost 90% of all volumes.
- CFTC data suggests 28% of NDF volumes have been cleared in 2022.
- Volumes are much higher in FX futures, but their Open Interest is lower than in OTC products.
- Open Interest in cleared FX products has increased by 45% in the past two years.
“March of 2020, 2021 and 2022 have all recorded successive all time highs in volumes”. May be completely unrelated but could it be related to Market Players in jurisdictions with Fiscal years ending March instead of December? There are a few March end FY jurisdictions in APAC (Japan, India…) and Fx dominance is in APAC currencies. That is where the idea/question comes from.