- We detail the GSIB methodology for US banks, referred to as “Method 2” in the literature.
- We calculate the GSIB scores for 8 US banks as at December 2018 and September 2019.
- We find that the Method 2 scores are particularly penal for Morgan Stanley.
- It will be interesting to see how these scores change into year end.
Following on from last week’s blog, Mechanics and Definitions of G-SIBs, I wanted to take a look at the methodology that is used in the US.
Gold-Plating the Basel Standards
It turns out that there is quite a bit of literature available on G-SIBs and the methodologies being employed in the US. I found the below particularly useful when researching this blog:
- Are Basel’s Capital Surcharges for Global Systemically Important Banks Too Small?
- Govregs, § 217.403 – GSIB surcharge through to § 217.406 – Short-term wholesale funding score.
- NIC RFY15 Snapshots.
Armed with those three references, I think most motivated readers can work out the methodology for themselves. Nonetheless, I will try to make your lives as easy as possible and outline the exact calculations below.
US versus the Rest of the World
In the US, banks are subject to two calculations:
- Method 1 is the Basel methodology, which we detailed in last week’s blog. It looks at 12 indicators of size and complexity, groups them into 5 broader groups and averages across them. Each measure is calculated relative to other banks in the “peer group” of large banks. For other jurisdictions, the maximum score in the “Substitutability” category is 500 basis points. In the US, it is capped at 100 basis points.
- Method 2 is applied only to US banks. It uses 9 of the 12 indicators from Method 1, but calculates the score based on the outright amounts (expressed in billions of dollars) and multiplies them by fixed co-efficients. A “short-term wholesale funding” score is then added to the G-SIB score. This short-term funding score is detailed here.
In essence, Method 2 differs from Method 1 because:
- It replaces the whole of the “Substitutability” category of indicators with a measure of short-term funding.
- It uses fixed co-efficients, rather than calculating a “market-share” based on other banks’ values each year.
- US banks must use the higher of Method 1 or Method 2 for calculating their applicable GSIB score. So far, I believe that Method 2 has always yielded a higher score.
Method 2 Coefficients
Method 2 is considerably easier to calculate than Method 1 GSIB scores because you do not need data from every bank in the sample. Rather, it uses the amounts in billions of dollars reported by each bank on their “FR Y-15” regulatory filings multiplied by fixed coefficients.
The official GSIB score is calculated as at 31st December each year, but these FR Y-15 filings are updated quarterly, so we can keep a close eye on the expected final G-SIB score for each US bank.
The co-efficients that are used per field of the FR Y-15 reports are shown below:
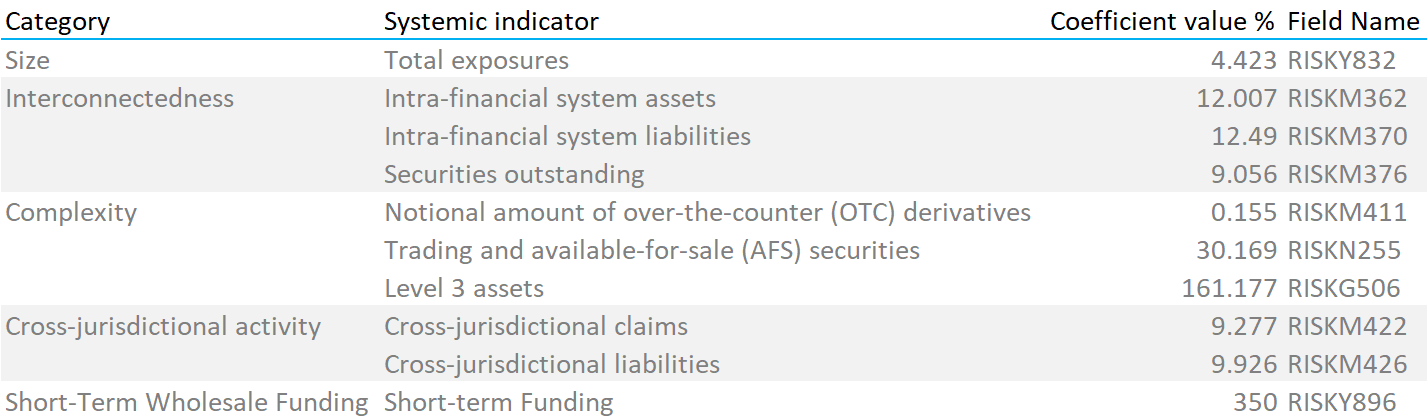
Note that the table above includes the coefficient for the Short-Term Wholesale Funding measure, filed “Risky896”. Note that this field is expressed in percentage terms on the FR Y-15 form, and that no conversion is necessary.
Method 2 Scores for US Banks
With that handy reference table, it really is a case of downloading a bank’s FR Y-15 report from the NIC website and running a sumproduct in Excel over the relevant fields. Pretty simple.
In light of which, I ran the numbers for the US G-SIBs using both the December 2018 scores (the “official” scores), as well as the most recent data as at end September 2019.
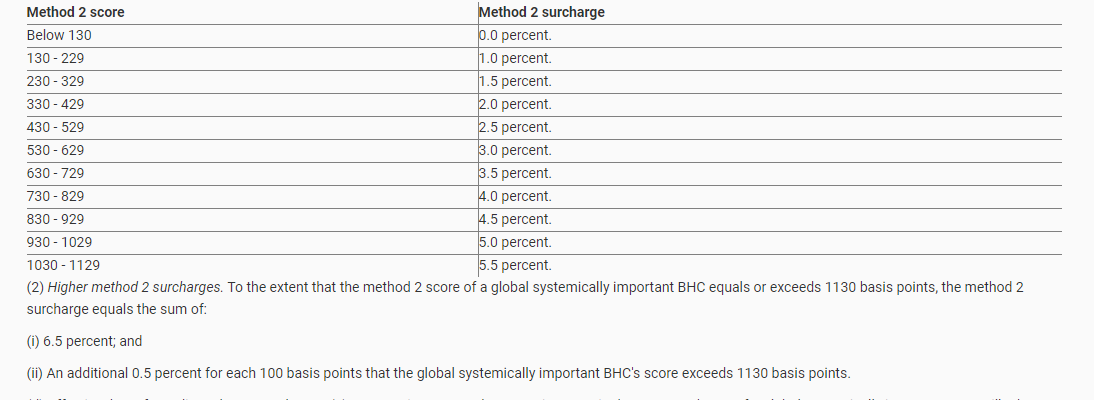
Remember that the amount of capital to be held varies as a function of the G-SIB score. These are the cut-offs for US banks:
Looking at the US banks that we identified last week (using the Method 1 scores) we see the following results:
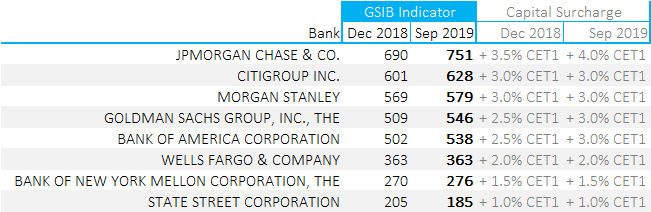
Showing;
- Just how much gold-plating has occurred in the US. Under Method 1, JP Morgan needed to hold an extra 2.5% CET1 as at Dec 2018. This was 3.5% under the US rules.
- Morgan Stanley have a considerably different result under Method 2. Method 1 required them to hold an extra 1.0% of capital, but Method 2 results in an extra 3.0%!
- I think the September 2019 numbers should be taken with a punch of salt. It is notable that all of the banks bar State Street have higher numbers for Q3 of this year. I am guessing there is quite a bit of GSIB optimisation/window dressing that goes on into year-end to improve the final scores.
In Summary
- The methodology used to calculate a US bank’s GSIB score is somewhat different to the global standard from the BIS.
- We find that this results in a US GSIB holding between 0.5% and 2% more tier one capital than if they were a GSIB elsewhere in the world.
- This is an example of the US “gold-plating” the global standards.
- The methodologies are transparent and relatively simple to calculate.