Guest Blog Series
Profile: Interest Rate Swaps trader. 12+ years’ experience, European and cross markets focused
With the Premier League back, we’ll have the joys of Super Slo-Mo replays and Hawkeye reconstructing every kick of every game for the next nine months. What if we could have the same for every trading day?
If you are a market-maker, you probably don’t want to relive the slip-ups, but then again, neither did Stevie G…..
However:
- As a customer, you can analyse your dealer’s performances.
- Any systematic strategy can now be back-tested against real transaction data.
First of all, lets look at daily USD IRS volumes in SDRView Researcher:
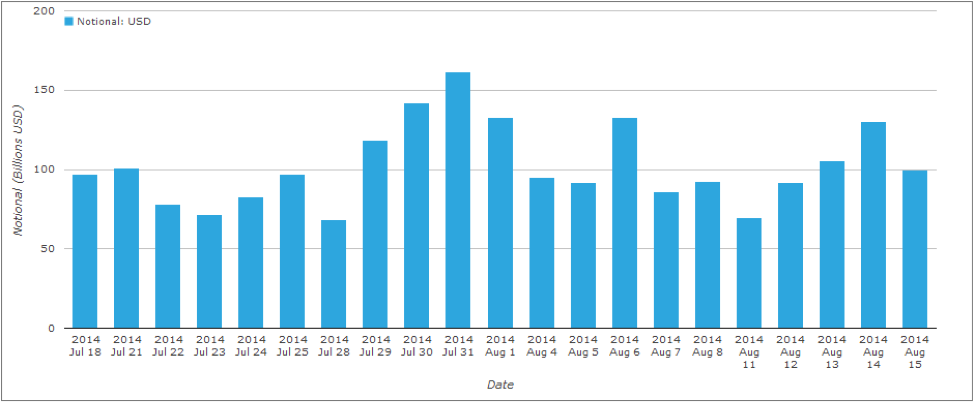
It’s worth noting that volumes do not seem to have been impacted much by the typical August lull this year.
Who says the market is not changing?
Seeing as we need to pick one day in-particular to analyse in Super-Slo-Mo, let’s go for the biggest trading day by notional – 31st July 2014. To avoid overwhelming amounts of data, let’s further focus on the sub-5y maturities.
Now, just as sports replays have been transformed from delayed, single-angle and juddery affairs into multiple-angle, game-changing technology, we can similarly use the SDRView API to get the full immersion experience.
First off, we need a way to deal with forward starting trades. Most liquidity providers treat forward-starting risk as fungible with its spot brethren, therefore let’s assume a 1y1y forward is equivalent to a spot starting 1y plus an equal-but-opposite 2y trade. For consistency, we bucket the DV01 risk with the shortest tenor as the “received” position and the longest as the “paid” tenor. This keeps the overall DV01 consistent with the overall notional (ignoring convexity effects), but can lead to a negative sum within certain buckets. This should not be an issue when considering a single trading session in isolation.
We first calculate the DV01 for each trade, and then linearly project the risk onto different risk buckets across the curve. The beauty of the SDRView API is that this process is entirely free form and hence configurable. For the purposes of illustration, let’s look at the evolution of risk during the trading session at the short-end of the curve:
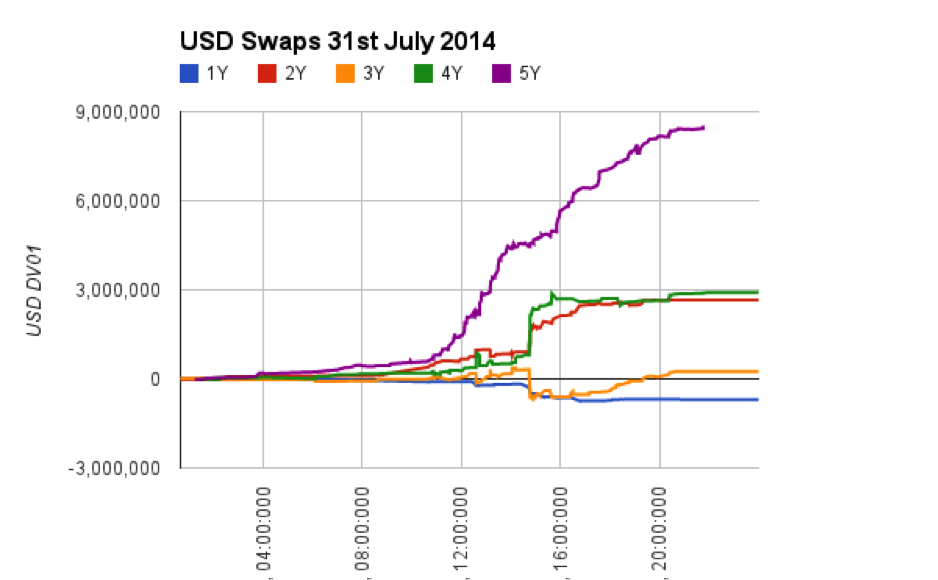
As we guessed, some of the buckets, particularly 1y, see a total DV01 that is negative. This simply means that most of the risk being taken in this area of the curve results from forward starting structures.
The 5y area of the curve sees the largest risks being traded. Whilst the DV01 can be seen to move in a fairly consistent “lower left to upper right” manner for 5y, the same cannot be said for every other maturity. It looks like the time around 14:45 GMT is key, so let’s zoom in on the peak trading hours between 13:00 and 16:00 GMT to have a proper gander:
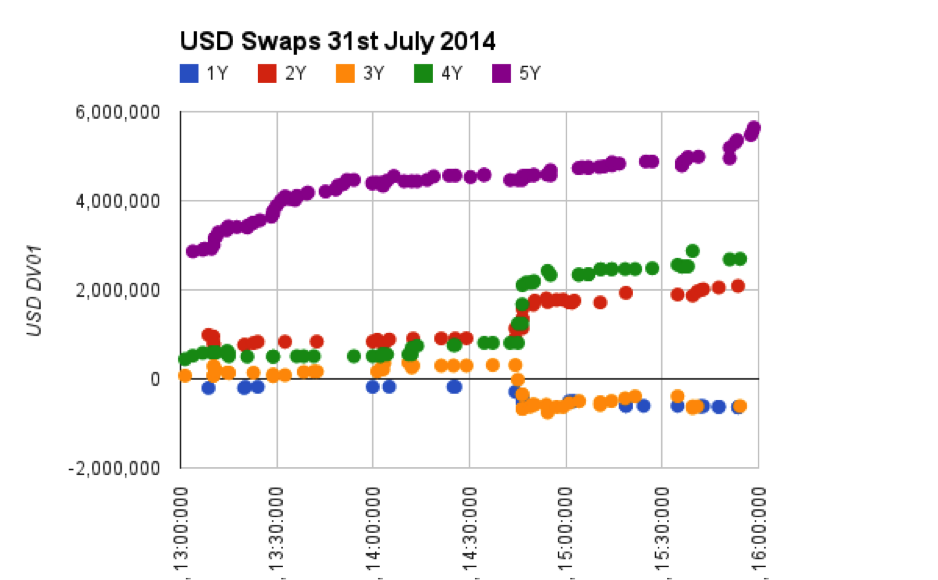
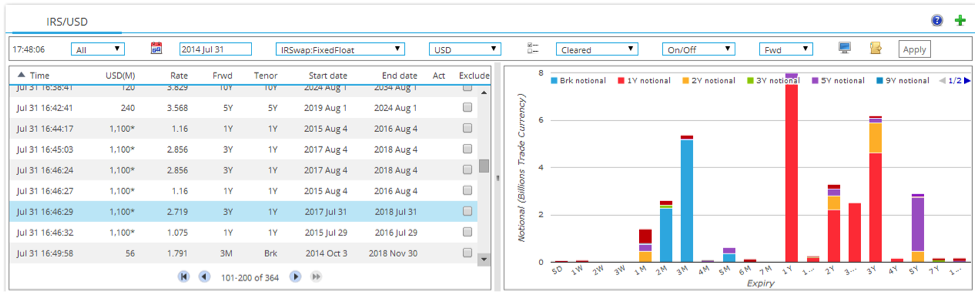
Hmmmm….interesting. 5Y volumes increase a good 90 minutes before we see the corresponding jumps (and dives) in 2y, 3y and 4y maturities. 4y is the most obvious jump, and using SDRView Pro we can see it is down to some highly leveraged forward trades going through at 14:45 (GMT time). All in block size too (apologies, the screenshot shows the time in CET, whereas the SDRView API records all trades at GMT).
Then lets drill-down on the 5Y tenor to look at the time-series of prices for the same time period.
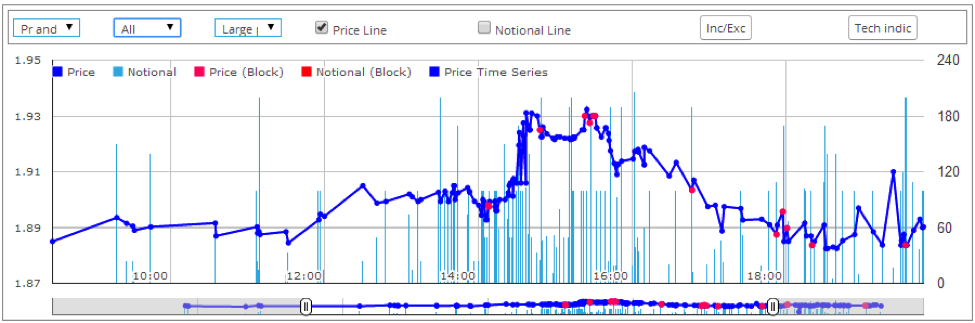
We can see that the sharp jump in 5y prices above 1.91% occurs:
- Around 15:00 CET, just as we see the DV01 beginning to sharply increase in 5y – something that is not clear if we look only at notional traded as this is during the busiest part of the trading day.
- Levels returning below 1.91% before the block trades are transacted at 16:46.
It therefore looks like these trades were left as an order to unwind an existing position, and hence the outright risk was worked through the market prior to the block trades being reported. Given the price action, we can safely assume it was an order to pay the forwards.
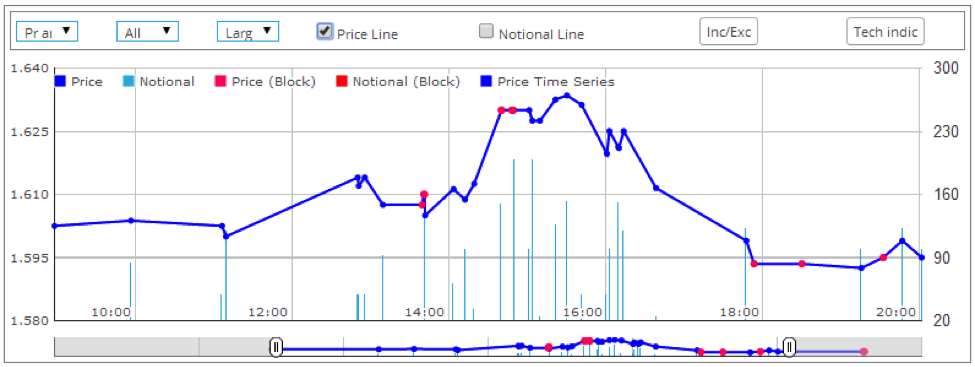
And just to be clear, we can see by the sheer lack of trades in the 4y that these large orders were not hedged-out like-for-like:
This is just one day, with just one story.
Analysing the data at tick-level using the SDRView API can unveil order flow that is otherwise hidden.
In time, even casual users such as I can build a database that allows us to track not only VWAPs of esoteric structures, but to follow orders moving through the market in real time.
And eventually we will be comparing current activity to historic averages on like-for-like trading days.
But for now I’ll leave that to those of you that are interested to try for yourself.