As year end is upon us, we sometimes like to perform some more lighthearted analysis.
Many of you will know that the US financial markets are covered well by cable news network CNBC; and I’ve become a fan of the lunchtime “Halftime Report”. At the end of each episode, they typically solicit a handful of stock picks from their panelists, which include some “regulars” as well as infrequent guests.
For a long while, I would ask myself “I wonder how each of these stock picks perform, and who is the best stock picker?”. Well, I set out to answer that question, here is what I did:
- I “watched” all 44 episodes from October 7, 2019 through to December 6, 2019 (In full disclosure I caught up on them on the CNBC website)
- Logged each stock pick done at the end of the show in the “Final Trades” segment, assigned to each regular panelist or within a general “Guest” category
- Determined the returns of each pick over various holding periods, ranging from T+1 through 1M, and hence the performance of each panelist stock picker.
And here are the number of picks for each panelist, and their average returns:
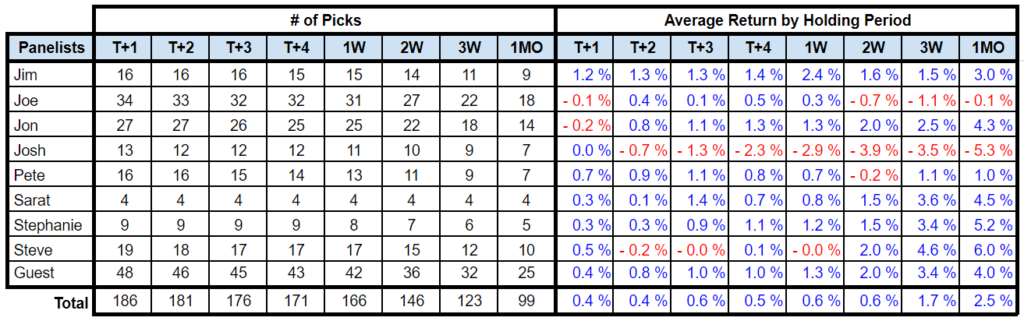
Quite impressive results, with an average one-day return across panellists of 0.4%. The best average 1-month return coming from regular panellist Steve Weiss, at 6.0%.
The other standout is Josh who has suffered from some picks gone bad. These include one-month returns on some of his picks including SLACK (-22.7% in 1 month from 7-Oct), Twitter (-28.9% since 18-Oct), and Shake Shack (-12.9% since 5-Nov).
Few clarifications / caveats here:
- The entry price is the closing price on the day of the pick
- All returns are log-returns so they can be readily summed
- Average returns look at the specific holding period. Meaning that Sarat’s “1W” average return represent the average of his 1-week returns from his four picks on 10-Oct, 16-Oct, 31-Oct and 4-Nov (through 17-Oct, 23-Oct, 7-Nov, and 11-Nov respectively)
- This analysis caters for when a panelist recommends shorting a stock, which only occurred once in the data set, but what a doozy – Smile Direct Club (SDC) – which has indeed plummeted since Joe made the call
- Probably the largest caveat though: These panelists are mostly traders, and as such will have some implied holding period in their call (eg “buy it and hold through earnings report”). I have made no attempt to deconstruct their holding period. For example, I doubt Joe recommends you short SDC in perpetuity. This analysis simply assumes you follow their call for a various prescribed holding periods.
Now, I know what you’re saying, this analysis has happened to take place during the largest 2-month bull market in years. So, of course we need to look at their performance vs the S&P 500.
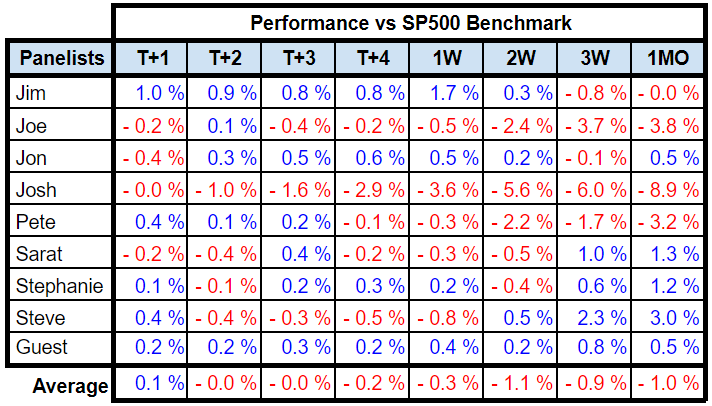
Herein lies the rub: With the exception of 1-day returns, the stock pickers in aggregate have not outperformed the S&P500.
Sure, if you pull out the stinkers like Slack, Twitter, Shake Shack (and many others), these numbers improve. But arguably you’d need to remove the big winners then, like Tesla (+28.9%), AMD (+25.4%), etc.
Of course, the relative performance also looks at like-for-like holding periods. Hence the 1MO relative return of a stock pick on 31-Oct is that stocks return compared to the same 1MO S&P return from 31-Oct. These can be added to other 1MO relative returns from a separate entry point. If this makes no sense, just trust me!
So what does this all tell us? Well, given all of the caveats, probably not much. But the adage “just invest in index funds” seems appropriate.
In a somewhat timely article by CNBC, they cite that only 22% of individual stocks have outperformed the S&P in the past two years. So I guess stock picking is hard work!
All the best for 2020.