Continuing with our monthly Swaps review series, let’s look at volumes in June 2017.
Summary:
- USD IRS price-forming volume > $2.1 trillion gross notional, similar to a year earlier
- SEF Compression activity in USD IRS > $300 billion, 51% higher than a year earlier
- On SEF IMM Roll volume > $60 billion
- USD OIS price-forming volume was > $2.7 trillion, again higher than USD IRS
- USD OIS Roll volume of > $700 billion
- EUR IRS and OIS volume is mostly Off SEF
- SEF Compression volumes in EUR, GBP, JPY IRS was > $150 billion, 50% of USD IRS
- USD, EUR, GBP, IRS, OIS and Basis Swap volume was $1.6 billion DV01
- Up from May and just below March highs
- Tradeweb the largest with $540 million DV01
- TrueEx with $710 billion gross notional in OIS
- D2C SEF volumes similar to March highs but D2D down from March
- TP-ICAP with $242 million DV01 (from TP and IGDL SEFs)
- BGC the largest in OIS with $429 billion gross notional
- CME–LCH Switch volume down to $43 billion, 50% of the high in March 2017
- Global Cleared Volumes at $30.5 trillion, up from April and May
- LCH SwapClear at $28 trillion is up 27% from a year earlier
- JSCC volume at $967 billion is up 28% from a year earlier
- In Asia, LCH SwapClear volume at $2 trillion is up 25% from a year earlier
- In LatAm, CME volumes at $612 billion is up from $205 billion a year earlier
- Inflations Swaps at LCH SwapClear, similar to prior month
- NDFs at LCH ForexClear up at $460 billion and close to March highs
Onto the charts, data and details.
USD IRS ON/OFF SEF
Using SDRView the gross-notional volume of On and Off SEF USD IRS Fixed vs Float price forming trades (Outrights, SpreadOvers, Curve/Flys).
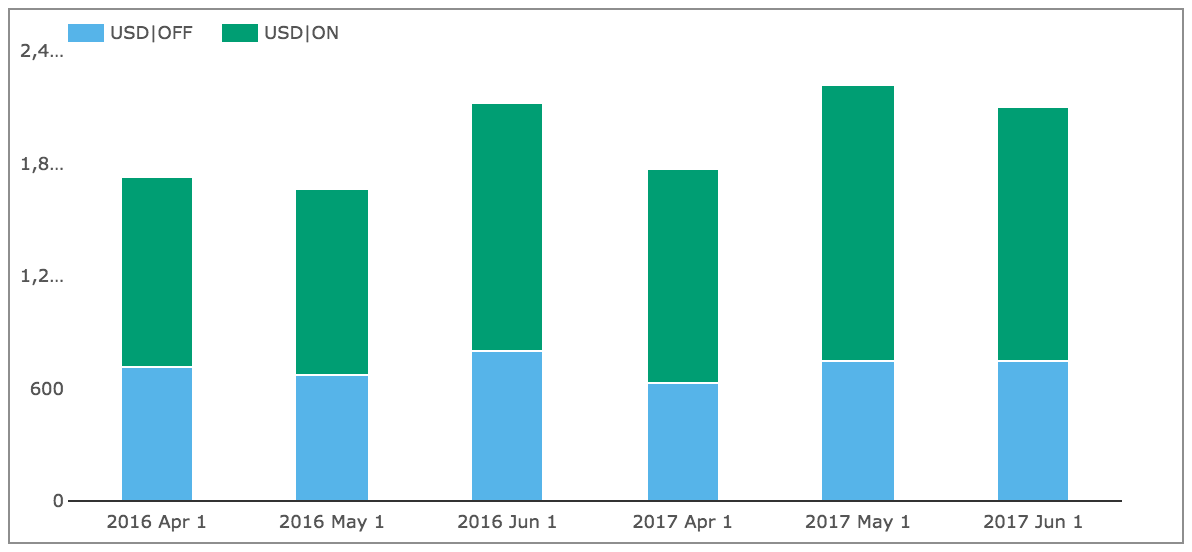
Showing:
- June 2017 On SEF gross notional is > $1.36 trillion
- (recall capped trade rules mean this is understated as the full size of block trades is not disclosed)
- This is 2% higher than June 2016
- June 2017 Off SEF gross notional is > $750 billion
- 6% lower than June 2016
- Overall gross notional was > $2.1 trillion, similar to a year earlier
- And On SEF vs Off SEF is 64% to 36%, close to the average
Next On SEF non-price forming trades; SEF Compression and Rolls.
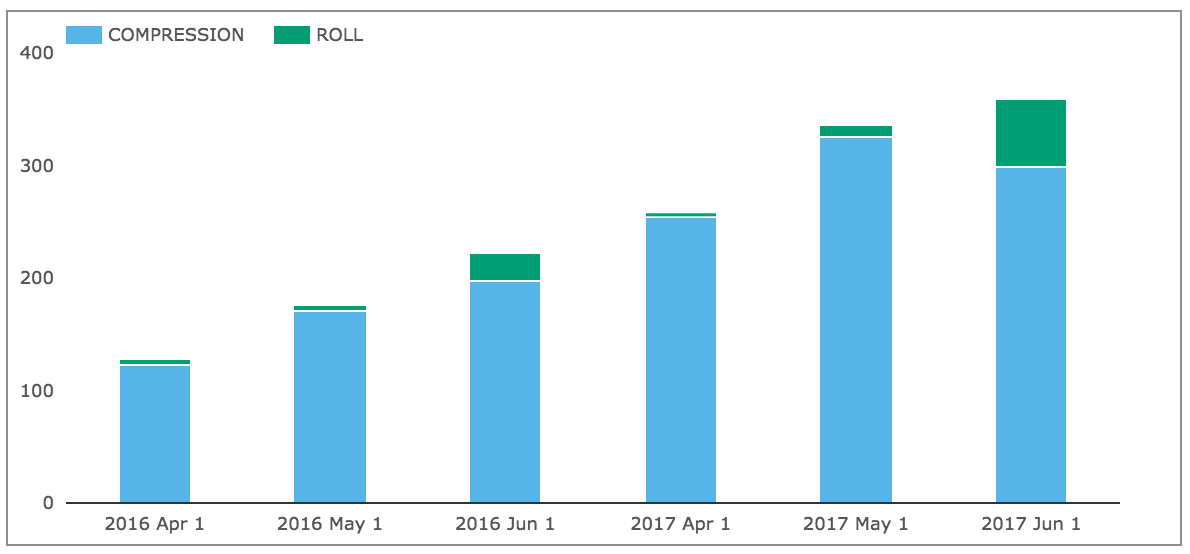
Showing:
- SEF Compression in June 2017 was > $300 billion
- This is 51% higher than June 2016
- IMM Rolls were > $60 billion
- 147% higher than a year earlier
A decent month for USD IRS in both price forming and portfolio maintenance trades.
USD OIS Swaps
Next USD OIS Swaps volumes for outright trades.
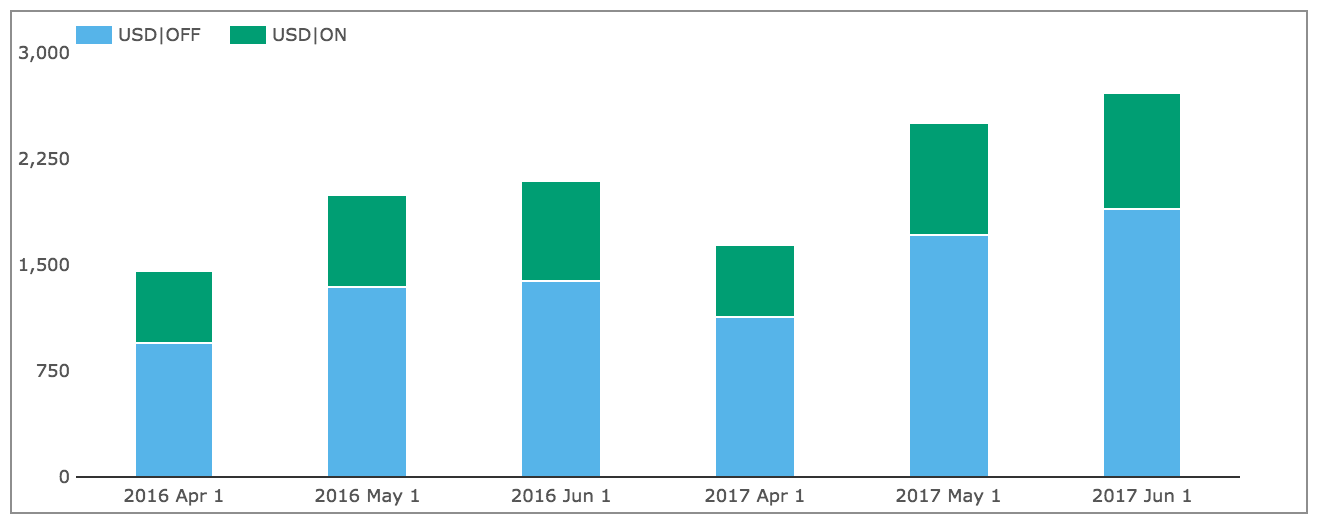
Showing:
- June 2017 Off SEF gross notional is > $1.9 trillion
- (recall capped trade rules mean these are understated as the full size of block trades is not disclosed)
- This is 37% higher than June 2016
- June 2017 On SEF gross notional is > $0.83 trillion
- This is 16% higher than June 2016
- An overall gross notional of > $2.7 trillion
- Which is 30% higher than June 2016
- In-fact June 2017 is higher than any month except March 2017
Splitting the volume by List (Roll activity) and Outrights for On and Off SEF.
Next Roll trade volumes in 2017.
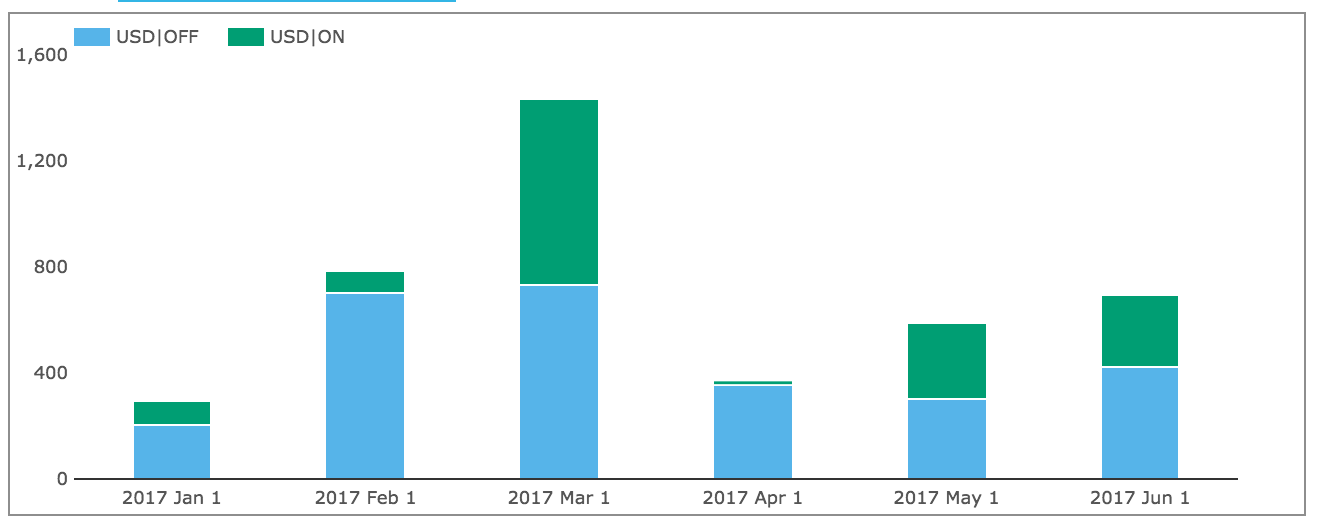
Showing:
- The high that we noted in the March 2017 Swaps Review
- June 2017 Off SEF gross notional is > $420 billion
- June 2017 On SEF gross notional is > $275 billion
- A total of > $695 billion
Once again in June 2017 USD OIS gross notional exceeded that of USD IRS.
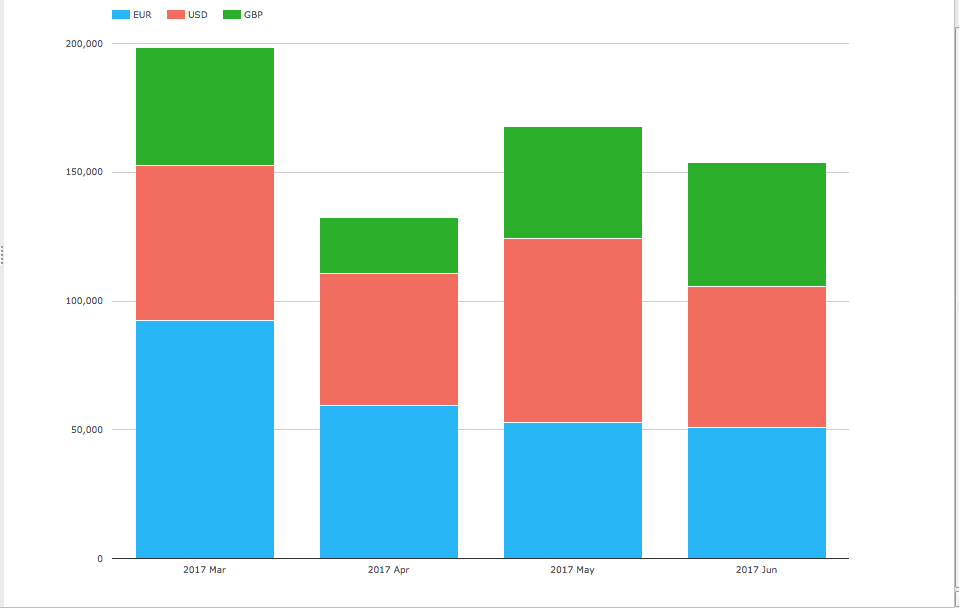
EUR, GBP, JPY Swaps
Next On and Off SEF volumes of IRS in the other three major currencies.
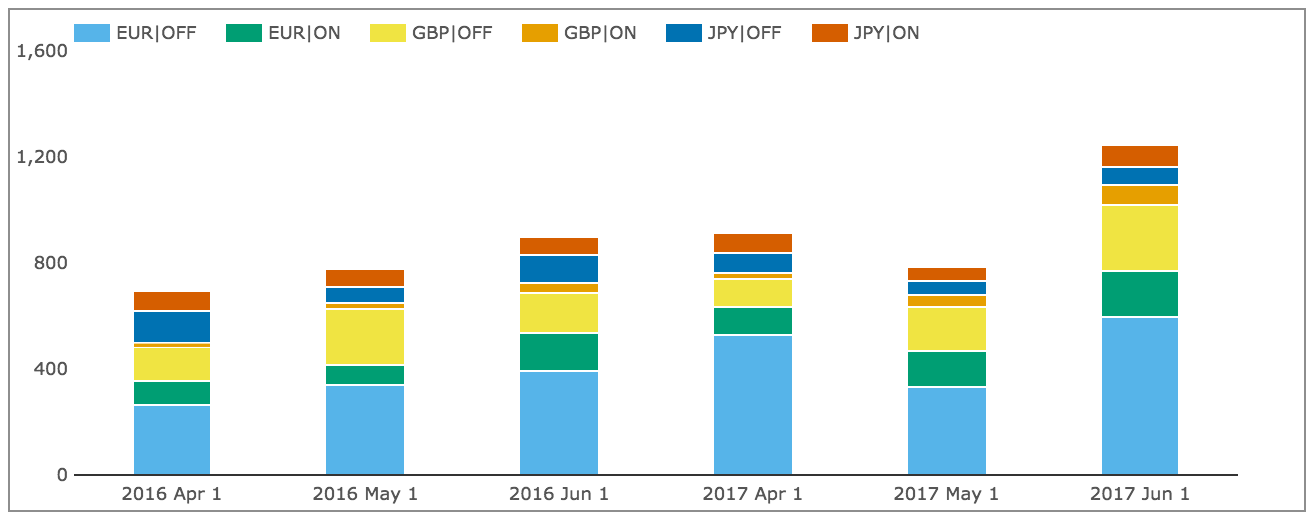
Showing:
- Volume in June 2017 was > $1,210 billion
- 38% higher than June 2016
- EUR Off SEF is the largest at > $600 billion
- GBP Off SEF is the next at > $250 billion
- EUR ON SEF next with $170 billion
- Overall Off SEF at > $920 billion is 123% of the USD IRS Off SEF
- Overall On SEF at > $324 billion is 24% of the USD IRS On SEF
Showing that a much higher portion of EUR, GBP, JPY is transacted Off SEF.
Next SEF Compression activity.
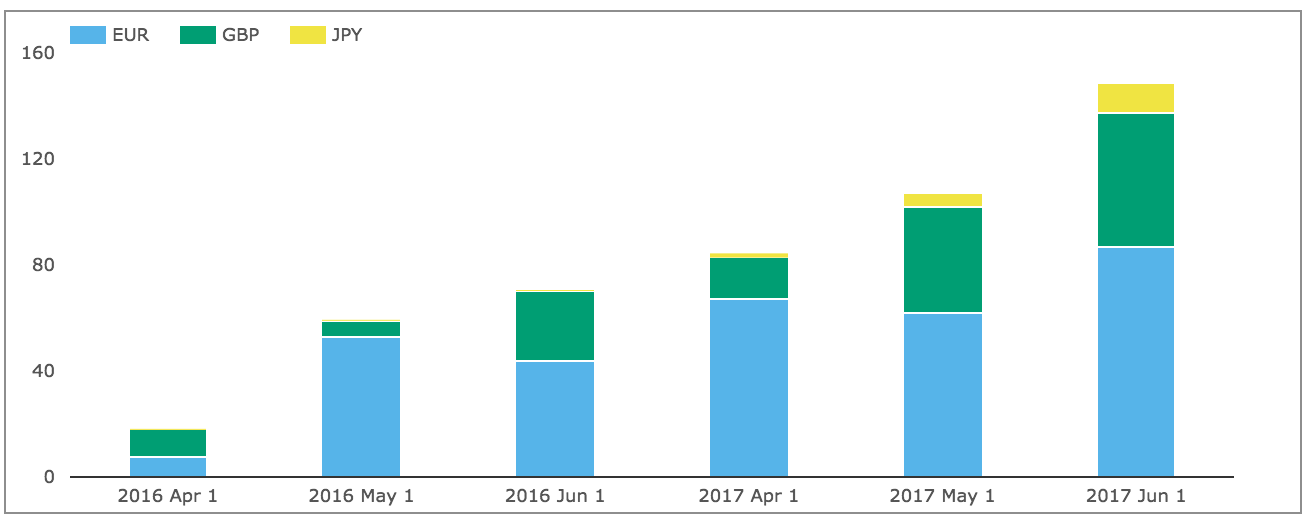
Showing:
- EUR volume in June 2017 is > $87 billion, 98% higher than June 2016
- GBP volume in June 2017 is > $50 billion, 89% higher than a year earlier
- JPY volume in June 2017 is > $11 billion, up from nothing a year earlier
- Overall volume in June 2017 is > $148 billion
- This is 50% of the USD IRS Compression volume
EONIA, SONIA, TONAR
Next lets check how volumes in EONIA, SONIA and TONAR have performed.
First for outright trades.
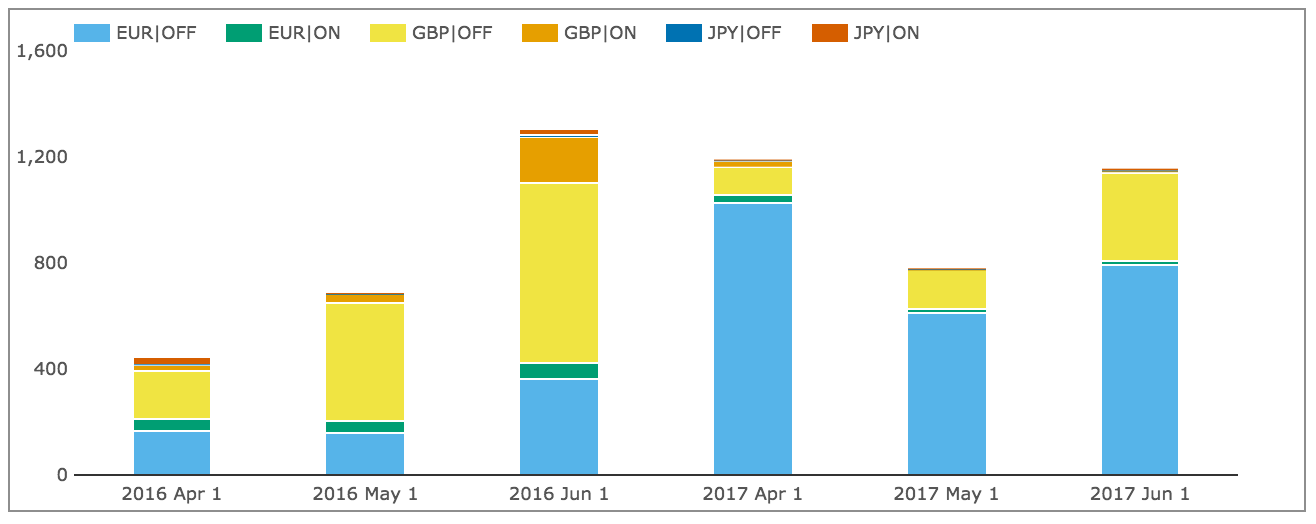
Showing:
- Volume in June 2017 was > $1.16 trillion, 11% down from a year earlier
- EUR Off SEF is by far the largest at > $800 billion
- GBP Off SEF is next with > $340 billion
- On SEF volumes are tiny compared to Off SEF
Second for Roll trade volumes in 2017.
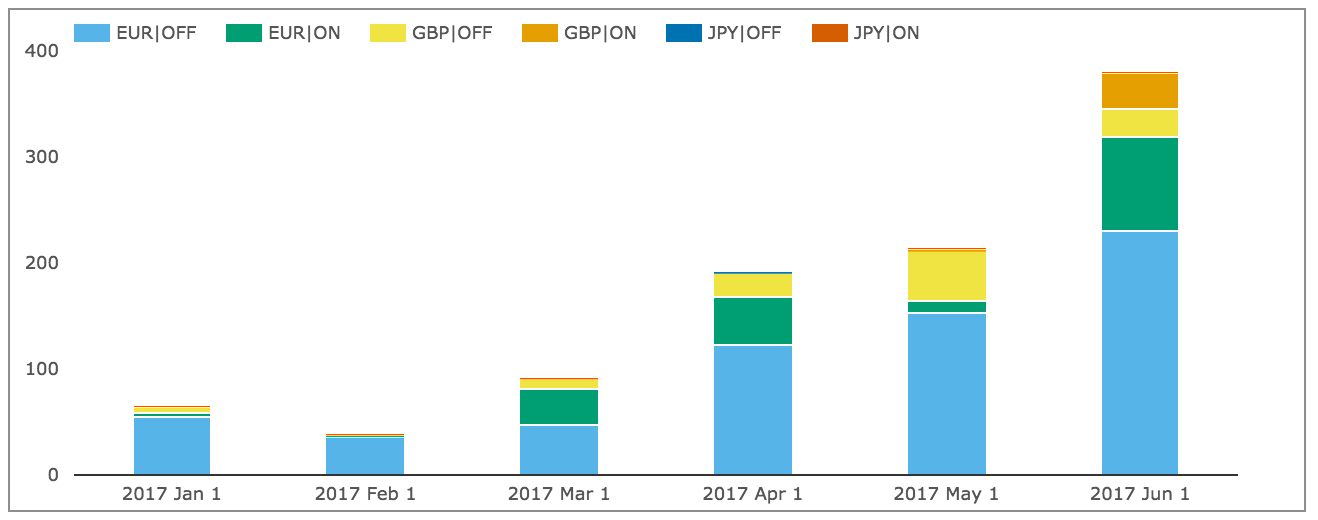
Showing:
- June 2017 is by far the highest month
- EUR Off SEF is by far the largest at > $230 billion
- EUR On SEF is next at > $88 billion
- GBP On SEF is next with > $35 billion
- A total of $380 billion is rolled, compared to the $695 billion of USD OIS
In June 2017, total OIS volume in EUR, GBP, JPY was $1.54 trillion, which is higher than the total of $1.36 trillion in IRS volume in these three currencies.
SEF Market Share
Lets now turn to SEFView and SEF Market Share in IRS including Vanilla, Basis and OIS Swaps.
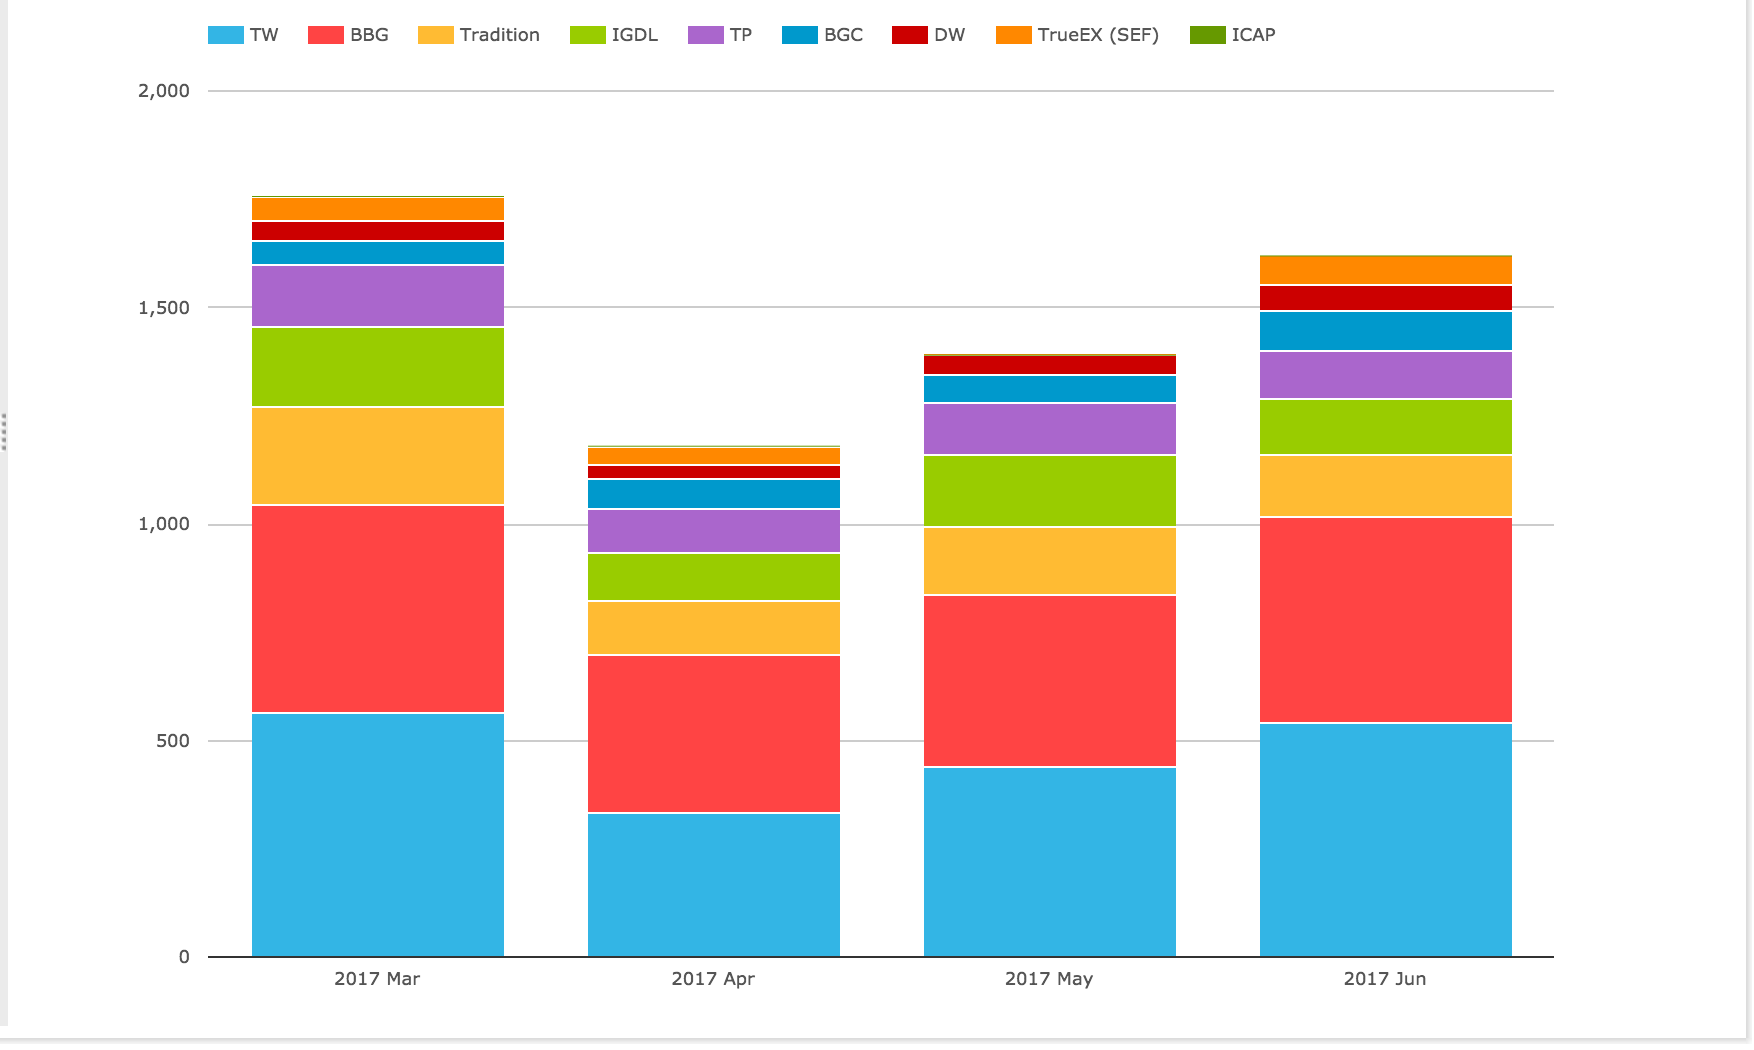
DV01 (in USD millions) by month for USD, EUR, GBP and by each SEF, including SEF Compression trades for the prior four months.
Showing:
Showing that:
- June 2017 volume at $1.62 billion DV01 is up from May and only just below the high in March
- Tradeweb has the largest volume at $540 million
- Bloomberg is next with $ 477 million
- TrueEx (the other D2C SEF) has $67 million
- The D2C total of $1.1 billion is similar to the March figure
- D2D SEF volumes in comparison are down from March
- $535 million in June 2017, compared to the $659 million in March
- Tradition the largest with $141 million
- IGDL and TP with $130m and $112m, a total for TP-ICAP of $242 million
- BGC with $89 million and Dealerweb with $61 million, are both up
In gross notional terms $2.3 trillion of USD IRS traded On SEF in June 2017.
Meaning that the $1.7 trillion in SDR for On SEF Price-forming and Compression/Roll should be increased by 35% to equal the SEF reported number, which is close to the 30% rule-of-thumb observed average.
In gross notional terms $1.9 trillion of USD OIS was reported On SEF, compared to the $1.1 trillion in SDR, meaning that the SDR number should be increased by 72% to equal the SEF number, showing the much greater impact on OIS Swaps, which tend to be very large in size due to capped notional rules.
TrueEx again had a big month in OIS with $710 billion gross notional, see March 2017 Swaps Review.
While BGC was the largest D2D SEF in USD OIS with $429 billion.
CCP Basis Spreads and Volumes
In SEFView we can isolate CME Cleared Swap volume at the major D2D SEFs (on the assumption that this is all CME–LCH Switch trade activity). Lets look at this for the past 4 months.
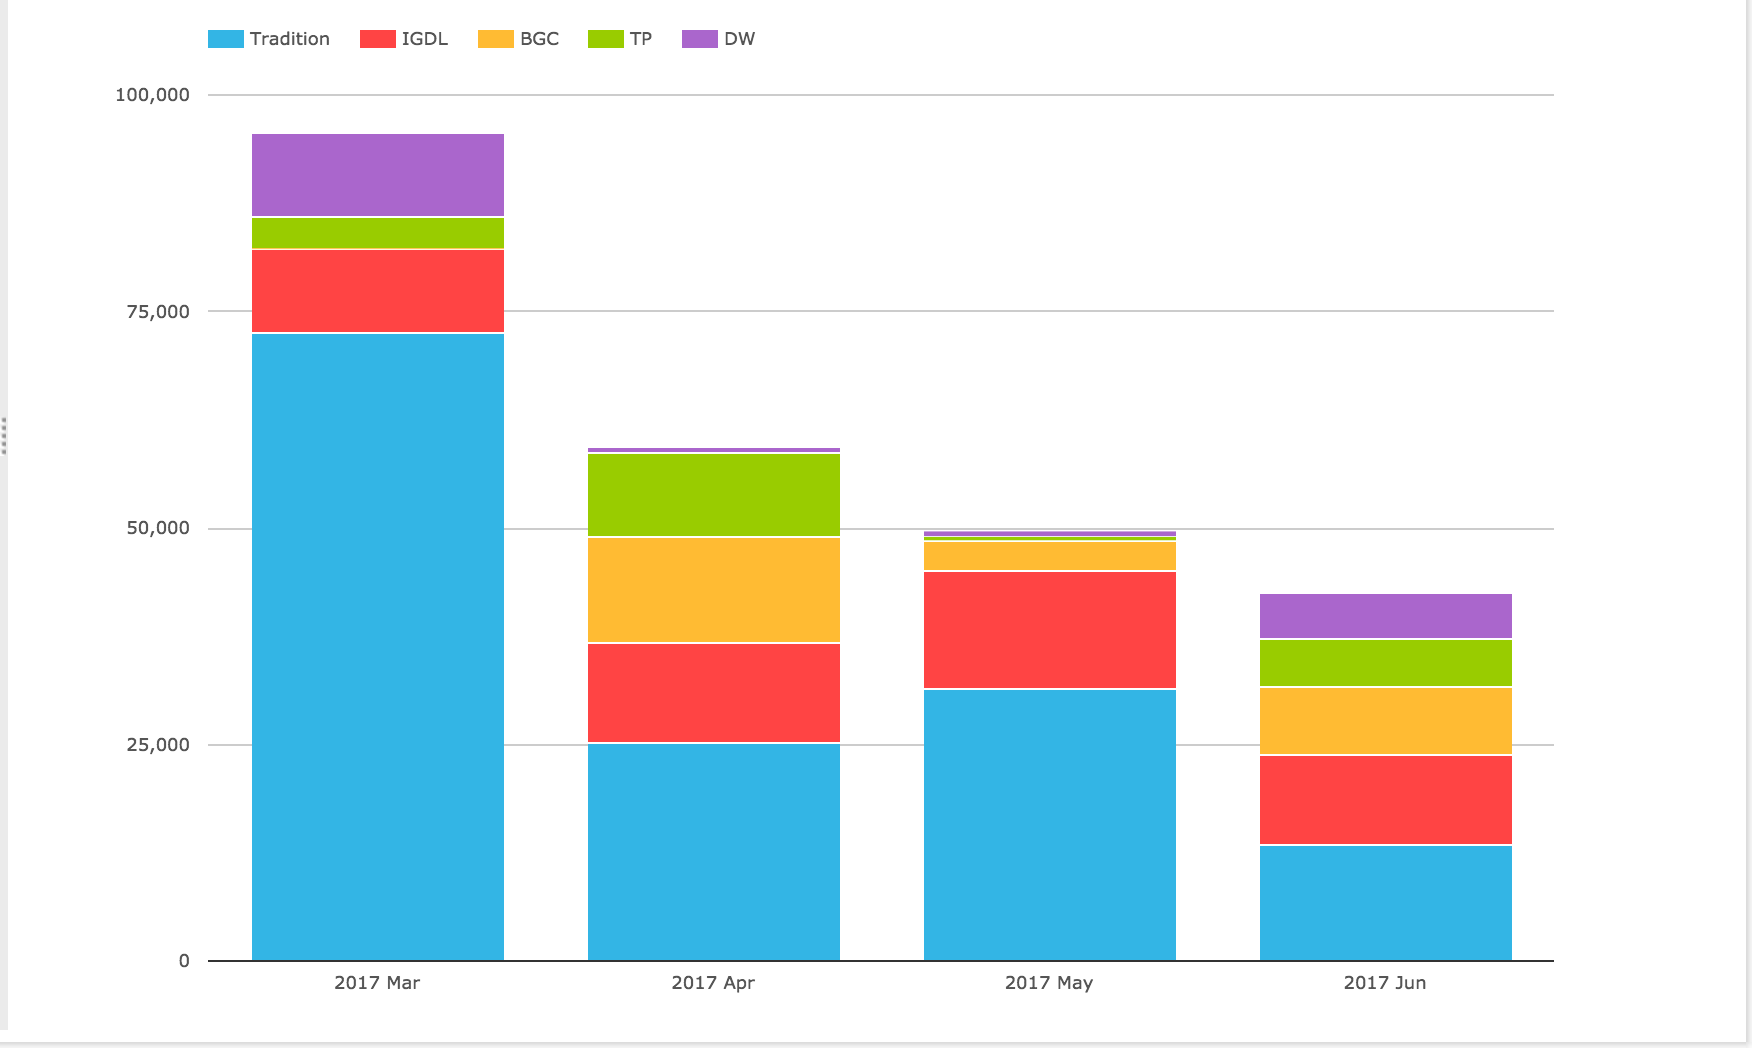
Showing:
- Overall volume in June 2017 was $43 billion
- Continuing the downward trend since the peak of $96 billion in March 2017
- Tradition the largest with $13.3 billion
- IGDL next with $10.6 billion
- BGC with $7.8b, TP $5.6b and Dealerweb $5.4b
CME-LCH Basis Spreads ended the month at 2.30 bps for 10Y and 3.30 bps for 30Y, both down 0.25bps from the prior month end.
Global Cleared Volumes
Next lets move onto CCPView and Global Cleared Swap Volumes of EUR, GBP, JPY & USD Swaps (IRS, OIS, Basis, ZC, VNS types).
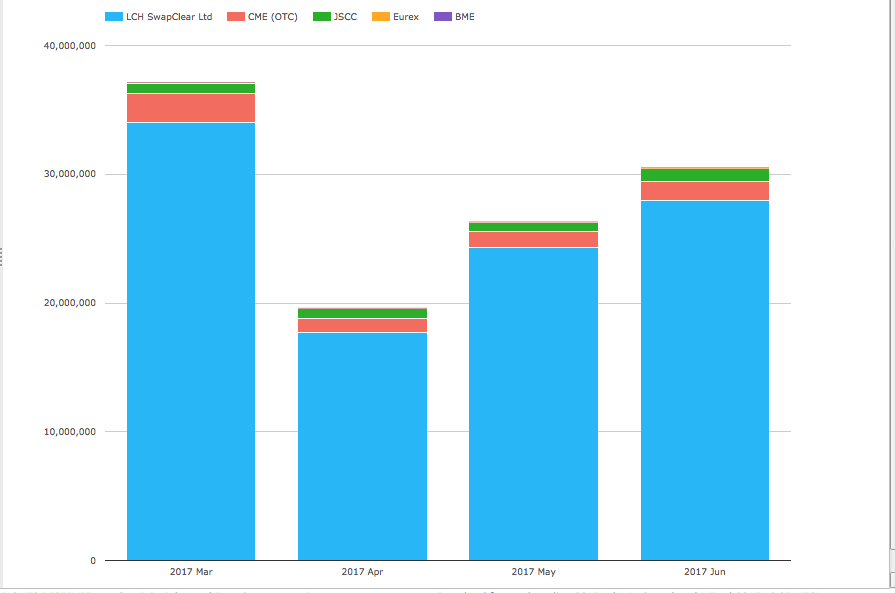
Showing:
- Overall Global Cleared Volumes in June 2017 of $30.5 trillion
- Significantly up from April and May, but below March
- LCH SwapClear volume at $28 trillion in June 2017, is up 27% from a year earlier
- CME volume at $1.5 trillion, is up 12% from a year earlier
- JSCC volume at $967 billion is up 28% from a year earlier
- Eurex with $88 billion, up from $53 billion in May and the highest on record
- BME with $47 million, down from $105 million
Asia and LatAm
Next the volume of AUD, HKD, SGD Swaps (including Vanilla, OIS, Basis, Zero Coupon).
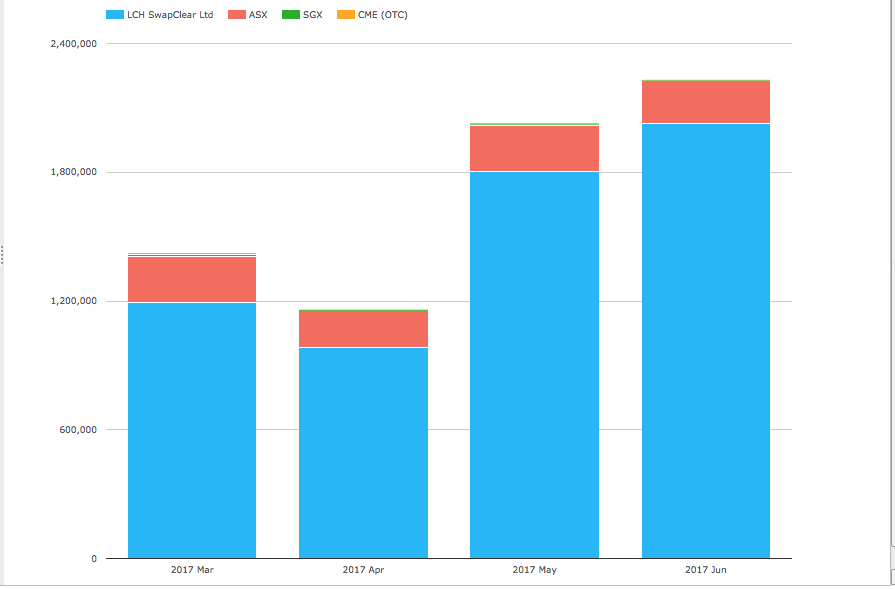
Showing:
- Higher volumes in June 2017
- LCH SwapClear at $2 trillion in June 2017 is up 25% from a year earlier
- ASX at $192 billion in June 2017 is down 18% from a year earlier
- CME at $1.5billion down from $7.7 billion in June 2016
- SGX at $8 billion, down from $11 billion in June 2016
LCH SwapClear volumes in June 2017, show good increases in AUD IRS, AUD OIS and SGD IRS from the prior month (not shown on chart).
And next the volume of MXN and BRL Swaps.
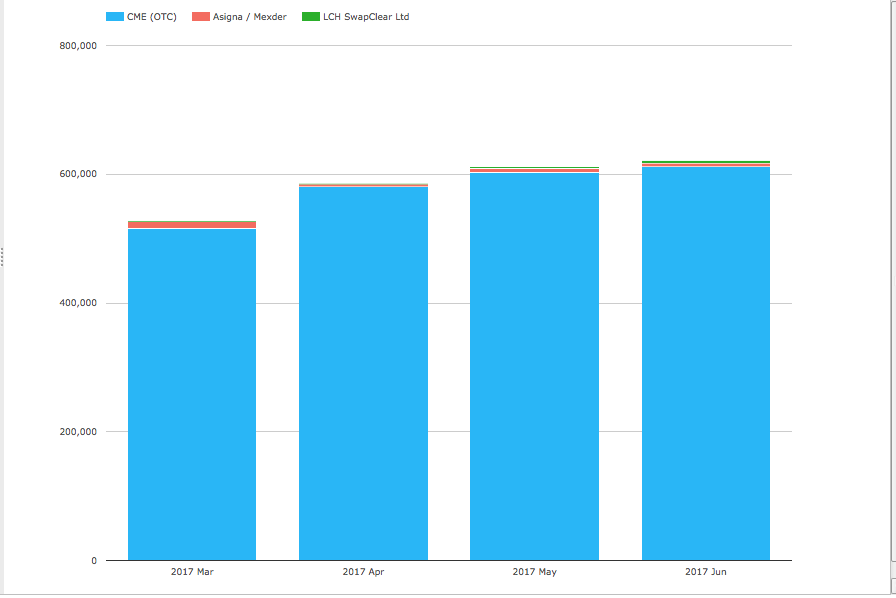
Showing:
- CME at $612 billion in June 2017, up from $205 billion a year earlier
- Asigna/Mexder with $5.1 billion, up from $3.5 billion a year earlier
- LCH SwapClear with $4 billion, up slightly from $3.7 billion in May 2017
Inflation Swaps
Finally lets look at the two products that have gained the most cleared volume from the Uncleared Margin Rules (UMR), starting with Inflation Swaps.
Showing:
- All the volume is at LCH SwapClear
- Total in June 2017 is $154 billion, down from $168 billion in May
- EUR, GBP, USD with similar gross notional in June 2017
Non-Deliverable Forwards
And last but by no means least, NDFs.
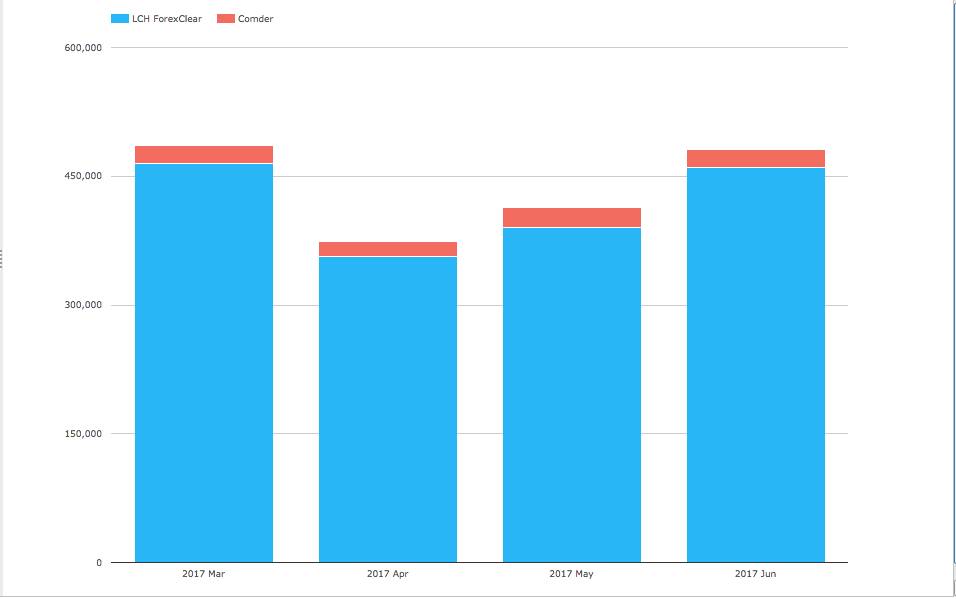
Showing:
- LCH ForexClear with $460 billion in June 2017, up from May and close to the record in March
- Comder with $21 billion, down from $22.7 billion in March 2017
That’s it for today.
Thanks for staying to the end.
Our Swaps review series is published monthly.