Update 09:45am EST 15th October. The final size of the LCH SOFR portfolio is now confirmed. It is about 15% smaller than the analysis below, at $9.1m gross DV01.
The ISDA-Clarus RFR Adoption Indicator has been published for September 2020. The headlines are:
- The RFR Adoption Indicator increased to reach close to the January high. It was at 9.5% in August 2020.
- This was considerably higher than the 6.4% in the prior month, but short of the 11% January 2020 high.
- 4.1% of all USD risk was traded in SOFR, higher than last month but still fairly low.
- Due to the discounting switch at LCH and CME this weekend (October 16th) we will focus on the SOFR market.
SOFR Market Size as a Percentage of Risk
The interactive charts of the RFR Adoption Indicator show that the size of the SOFR market has slowly been increasing relative to the overall rates market:
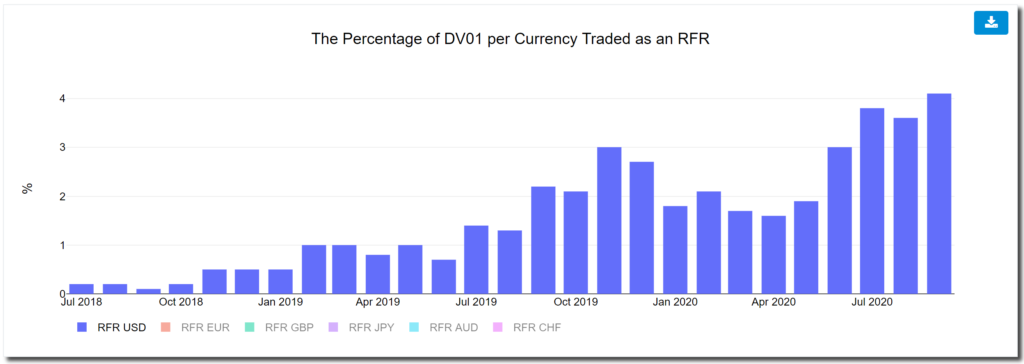
SOFR now makes up 4.1% of total risk in USD rates markets, rising from under 2% a few months ago.
That still seems a small portion of the market. Therefore it is natural to ask how the upcoming switch to SOFR discounting at the CCPs will impact the market.
To answer that, I think we need to assess the absolute size of the SOFR market. We can then compare that to the amount of risk that will be offloaded into the market as a result of these discounting changes.
SOFR Market Size in DV01
For September 2020, we can directly observe the SOFR DV01 reported to US SDRs from SDRView. This is not the global market, but is a starting point:
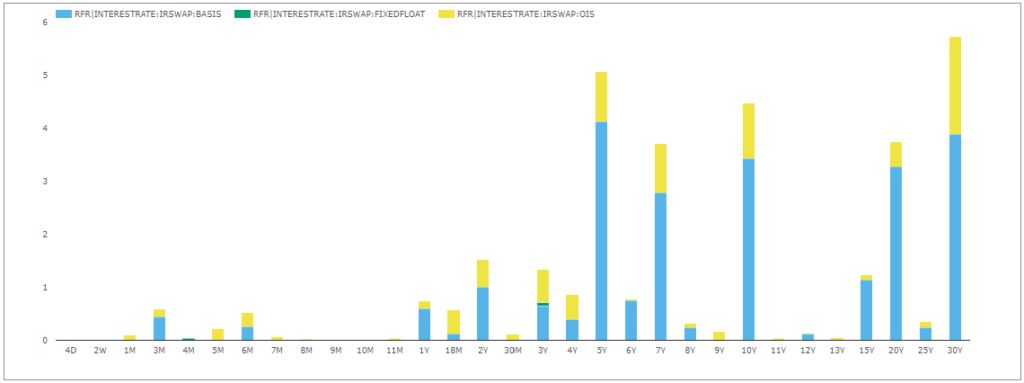
The chart shows for September 2020:
- Risk executed in SOFR-linked products. This covers both outright SOFR OIS and any basis swaps versus LIBOR or Fed Funds.
- 30Y risk was the most traded tenor during September.
- This was followed by 5Y, 10Y and 20Y buckets.
- This really highlights the long-dated nature of the SOFR OTC activity that occurred during September 2020.
- The total DV01 reported to SDRs was $32.6m.
- Of this, $28.1m was in tenors longer than 2 years (86% of activity!).
- Please note this differs to the ~10% figure of SOFR activity longer than 2 years from Chart 5 on our RFR Adoption Indicator dashboards, mainly because it excludes futures (ETD) activity.
To estimate the total size of the global market, we can scale-up the notional amounts in each SDR bucket by the delta between the CCP-reported notionals and those in the SDR. The difference in September 2020 was about 1.85x, giving a total DV01 traded in SOFR of $60.5m. This covers both outright and basis products.
LCH SOFR Auction Size
LCH are providing updates on the size of the SOFR auction to be held. The penultimate update was provided at the beginning of October:
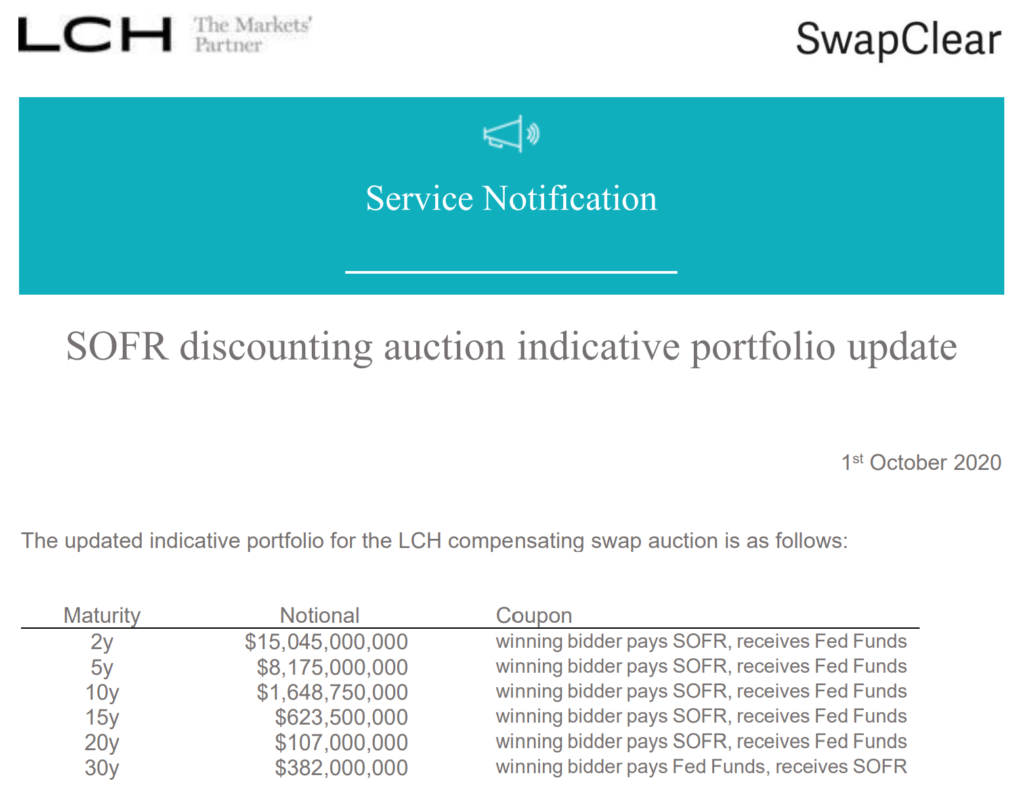
In terms of DV01 amounts, this equates to:
| Maturity | Notional ($) | Gross DV01 ($) |
| 2Y | 15,045,000,000 | 3,024,045 |
| 5Y | 8,175,000,000 | 4,071,150 |
| 10Y | 1,648,750,000 | 1,605,883 |
| 15Y | 623,500,000 | 883,500 |
| 20Y | 107,000,000 | 195,810 |
| 30Y | 382,000,000 | 990,526 |
| Gross Total | 25,981,250,000 | 10,770,913 |
The auction process will therefore invite dealers to provide their prices for Fed Funds vs SOFR basis swaps per maturity. Dealers can bid for the whole size or for portions of the risk per tenor. Remember, these are basis swaps and not outright risk.
Translating this auction size into DV01 amounts therefore reveals:
- The total size is likely to be around $11m in DV01 of SOFR basis risk (vs Fed Funds).
- Two-thirds of the DV01 is 5Y and shorter. Most of the SOFR basis risk is therefore short-dated.
- In terms of gross SOFR basis risk, $11m in DV01 is equal to about 18% of the amount of SOFR risk traded during September.
- The auction will therefore try to compress about one week’s worth of trading into a single session.
- In terms of net risk, there is only one bucket that partially offsets the others.
- 30Y positions are the other way round to all others, resulting in a net risk of $8.8m DV01.
The exact split in terms of notional and DV01 is best described by their relative sizes:
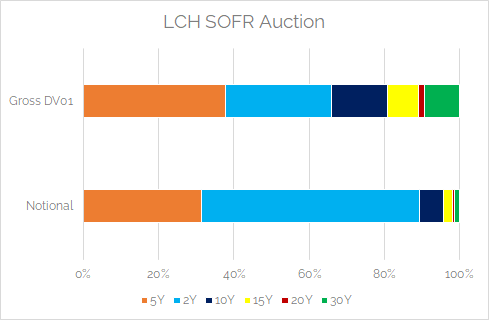
- 38% of SOFR risk will be in the 5Y bucket.
- A further 28% will be in the 2Y tenor.
- The long-end makes up a moderate amount of the risk, with 19% of risk longer than 10Y.
Remember, this is all basis risk we are talking about, not outright risk!
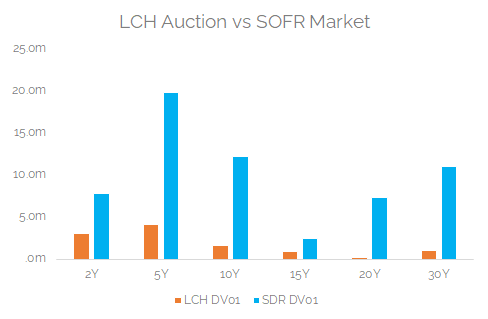
The LCH Auction vs SOFR Market
We now sanity check the size of the bucket risk from the LCH auction versus what has been trading in the market. We therefore translate the SDR risk into the same buckets as used by LCH.
Showing;
- Nothing too scary to see here!
- The biggest bucket of risk in the auction, 5Y, is a small portion of overall market activity. About 4.8x more risk traded in the 5Y during September 2020 than is being auctioned.
- Of course we are trying to compare a point in time auction versus monthly notional amounts. But traders are frequently asked to price risk that will take a month to process through the market, so it is not that unusual.
If we assume a 22 day trading month, maybe it is therefore better to look at the auction sizes in terms of how many average days it would take to hedge the risk?
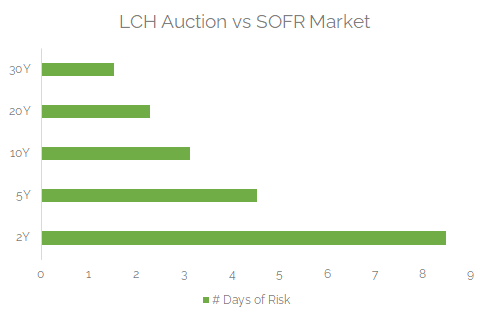
Showing;
- We have tried to estimate how many days of hedging it might take to take down the full auction size in each tenor bucket.
- This assumes one counterparty is effectively on every SDR trade in each tenor bucket, so obviously not realistic!
- However, it gives us some idea of the relative sizes of the risk.
- At the long-end we have bucketed the 15Y risk into the 10Y and 20Y buckets as there hasn’t been much SDR activity specifically in 15Y tenors.
- The amount of risk in the 10Y-30Y tenors is probably not that scary, assuming that the SOFR market continues to grow and increase in liquidity.
- We would expect much of the 2Y risk to find its way into the SOFR Futures market, which is excluded from this analysis.
- That means we expect most of the pricing pressure during the auction to be on the 5Y area of the curve.
- The amount being auctioned in the 5Y bucket represents about 4.5 days of typical SOFR activity.
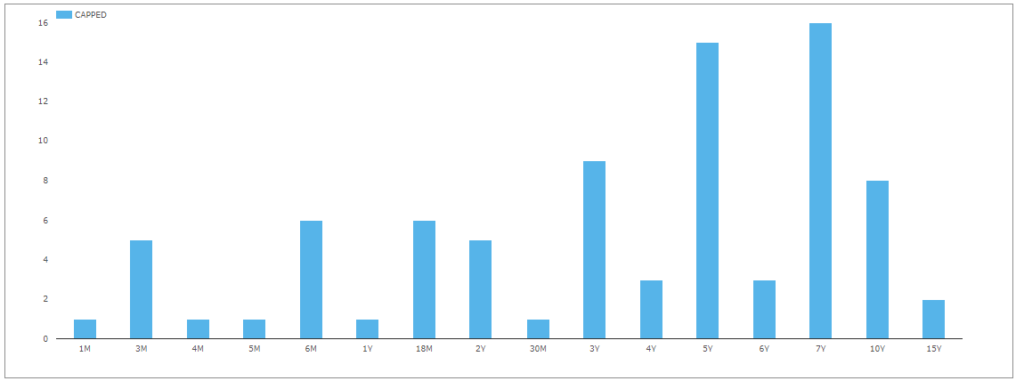
This last part of the analysis helps to explain why:
- 5Y and 7Y buckets in the SDR data have been very active.
- We have seen more capped notional trades (“blocks”) in these tenors than any other area of the curve:
October 15th 09:30am EST
The final estimate from LCH regarding the potential auction size will be given tomorrow, in about 24 hours time from this blog going live.
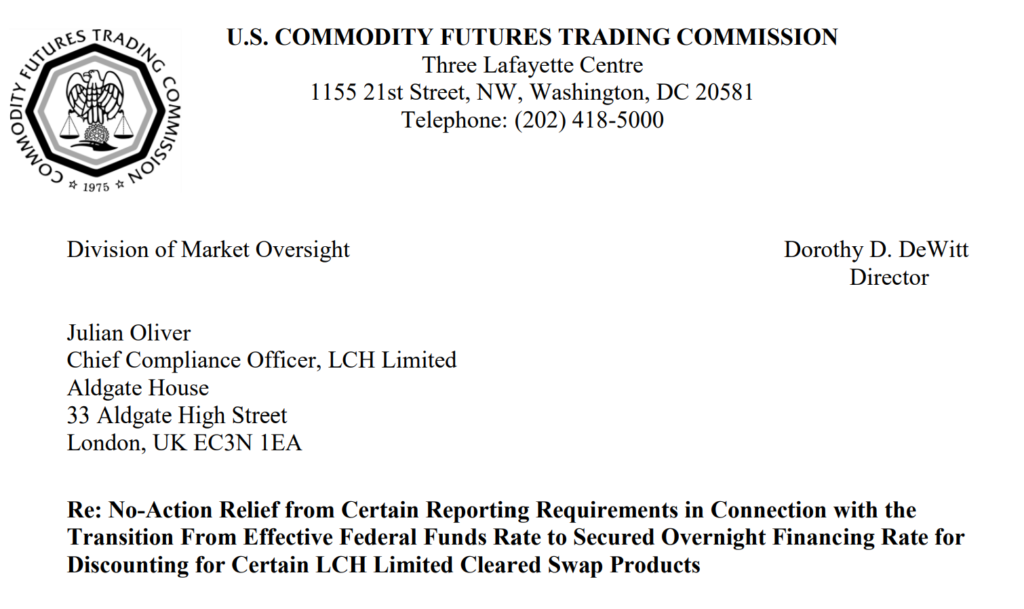
LCH will then update their website with the final results of the auction on the day. This is great news, because the precise auction swaps will not be reported to the SDRs until four weeks later. This is due to the nature of the auction and a specific no action letter just published by the CFTC:
The SDR will of course continue to show any activity related to the hedging of these auction swaps though, so expect it to be busy!
CME
Finally, it is worth noting that the LCH auction process will be slightly different and at a slightly different time to the CME, as outlined here:
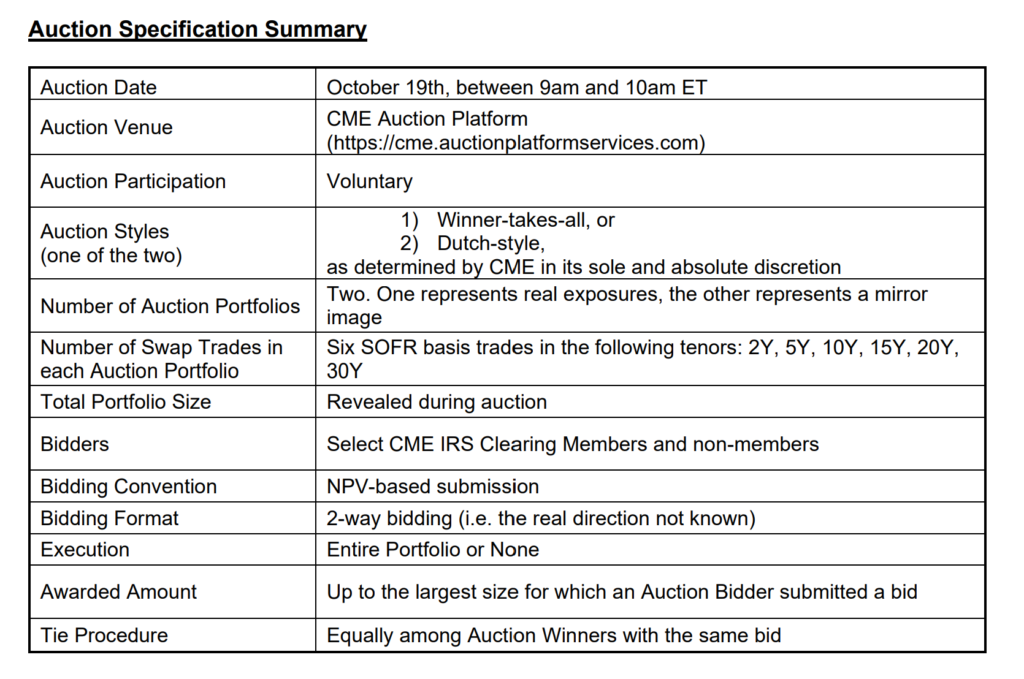
We therefore do not know the sizes or direction of the CME swaps and likely never will do. A similar no-action relief letter from the CFTC has also been issued for CME in terms of SDR reporting, although the CME document suggests they will report the swaps on the day of the auction.
In Summary
- LCH have provided transparency over how much SOFR basis risk will be auctioned into the market as a result of their discounting switch.
- We estimate this to be around $11m of gross SOFR DV01 basis risk, with the net risk equal to $9m DV01.
- Comparing the auction sizes to typical sizes traded per tenor, we estimate that the 5Y amount in the auction is equal to nearly 5 days of trading activity.
- Remember that this is all basis risk, expressed as the spread between Fed Funds (the old discounting index) versus SOFR (the new discounting index).
Given that SOFR introduces volatile repo risk into the swap book and there is still plenty of liquidity in FEDFUNDS, I think traders will want wash SOFR risk into FEDFUNDS as it is easier to hedge.
FEDFUNDS is not going to disappear like LIBOR (EFFR has been published since the 1950’s). My bet is that FEDFUNDS based swaps will continue become the main interbank market and SOFR becomes the client facing index.
What are your thoughts Chris?