- We summarise the portion of risk that is traded as OIS across seven major markets.
- Benchmark reforms around the globe are helping transition trading away from Libor into Risk Free Rates.
- We can monitor the progression of these reforms by looking at the current state of play in each market.
OIS Changes
The 1 year USD Libor vs OIS that we have been monitoring has continued to be volatile since we last blogged on the subject. This week I wanted to focus on something a little bit different rather than the absolute value of this spread:
How much risk trades in OIS versus how much risk trades in Libor products?
This was a question that one of our would-be clients recently posed to me. That makes me think that Clarus are uniquely positioned to answer these kind of questions via our data products. Particularly as we recently added DV01 calculations to OIS in SDRView (free trials here).
GBP – Sonia Trading in the United Kingdom
I’ll start with the UK because SONIA is in the news this week. How much risk trades in SONIA compared to the overall market? Risk magazine suggests there has been a shift toward longer tenors traded in SONIA recently. We’ll let the data tell the story.
All of the charts below show the DV01 traded as LIBOR-based products (and reported to US SDRs) and OIS products. The orange lines are the percentage of risk traded each month as OIS.
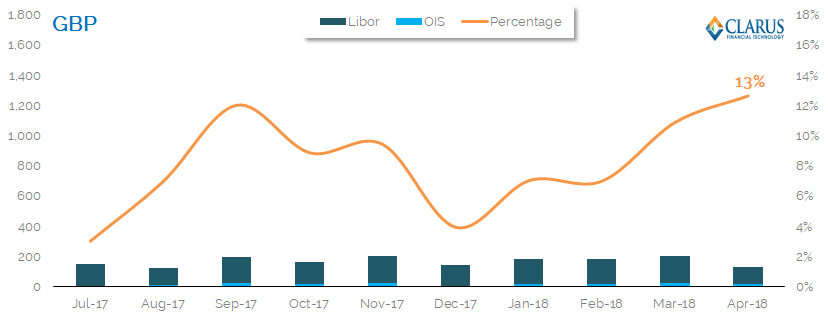
The scale on these charts has been kept constant so that we can compare GBP, USD, EUR and JPY. This gives us a good indication of overall market size.
For GBP, the chart shows that;
- There is an impressive 13% of risk currently traded in OIS (SONIA) products.
- The overall amount of risk traded (and reported to US SDRs) is comparatively small in GBP (compared to USD).
- As you will see, GBP leads the way in the proportion of risk traded as OIS.
- Remember, this is even before the BoE has taken over administration of the benchmark.
- There has been a clear trend since December last year of increasing amounts of OIS risk traded (relative to LIBOR), backing up this Risk article.
- This suggests that benchmark reforms and the adoption of preferred Risk Free Rates is progressing nicely in the UK.
USD – Fed Funds trading in the US
And what about the US then?
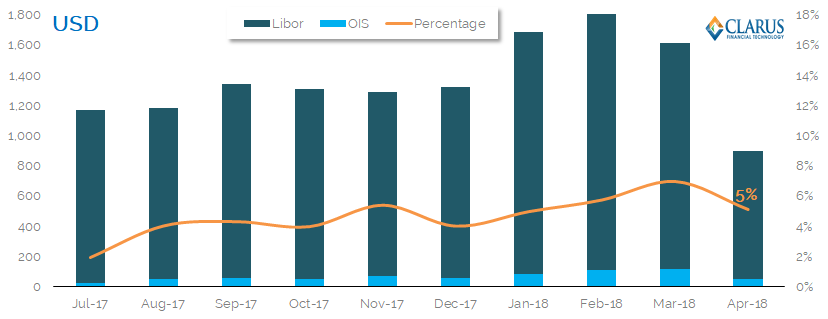
Showing;
- The largest amount of risk reported to US SDRs is in USD – no surprises there. It also means that we capture a much larger portion of the market than for any other currency.
- Only 5% of total USD risk is traded as an OIS swap. This excludes basis trading (we look at only outrights) which may explain some of the gap to e.g. GBP markets.
- Maybe the introduction of the SOFR index will change things up in the largest swap market?
- It is interesting to note that whilst Libor-OIS spreads have been widening dramatically (and basis volumes increasing alongside it), we haven’t seen a meaningful change in the amount of outright OIS traded in the past year.
- Benchmark reform and RFR adoption has some way to go for USD markets.
EUR – Eonia trading in Europe
What about Europe? We are only at the beginning of benchmark reform here, and yet…
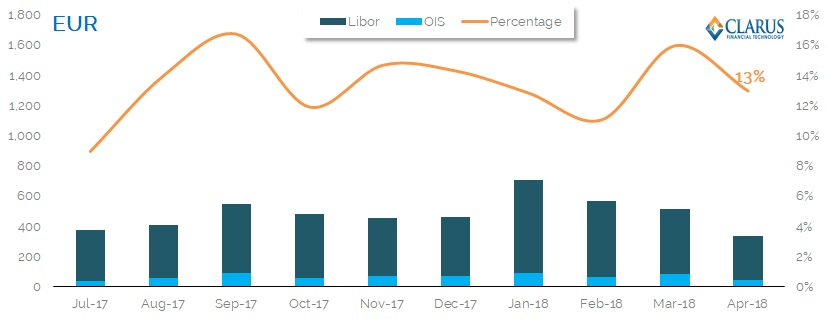 Showing;
- EUR swaps are the second largest market reported to US SDRs.
- They show a lot more OIS trading than in USD markets.
- The proportion of risk traded as OIS has reached as high as 17% in the past. And has consistently been around the current 13% level.
- There is not much trend to talk of.
- We have looked at the invoice spreads in the past that drive much of these OIS volumes in the interbank market.
- It is an OIS market that has significant liquidity in tenors longer than two years.
- With the ECB yet to choose a preferred RFR, the market is at least starting from a very high baseline to allow an easy transition away from Euribor.
- MIFID II data will give us a better idea of the market – this chart is somewhat skewed by a reporting bias in the US SDR data.
JPY – Tonar trading in Japan
Not much JPY risk is reported to US SDRs.
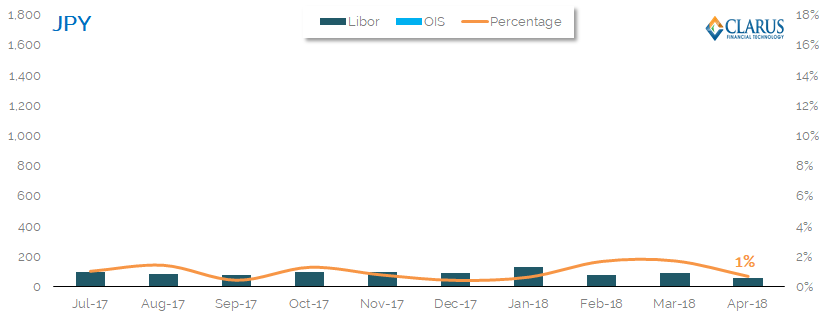 Showing;
- A tiny portion of the JPY swaps reported to US SDRs are OIS (TONAR). Less than 1%.
- From our previous article, we know that the BoJ is the administrator of this index already.
- Is there much more reform that regulators can make to this market? Trading needs to start transitioning away from LIBOR.
- Maybe the JSCC’s push into OIS clearing will help?
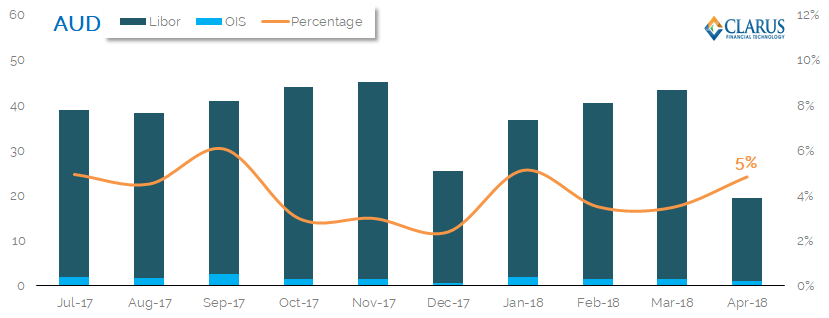
AUD – AONIA trading in Australia
For all other currencies, I have changed the scale on the charts so that the OIS volumes show up! Starting with AUD:
 Showing;
- A decent amount of OIS (AONIA) risk is already reported to US SDRs.
- At 5%, the AUD market is similar to USD.
- The RBA are already the administrator of this benchmark, so more still needs to be done by the market to encourage OIS trading.
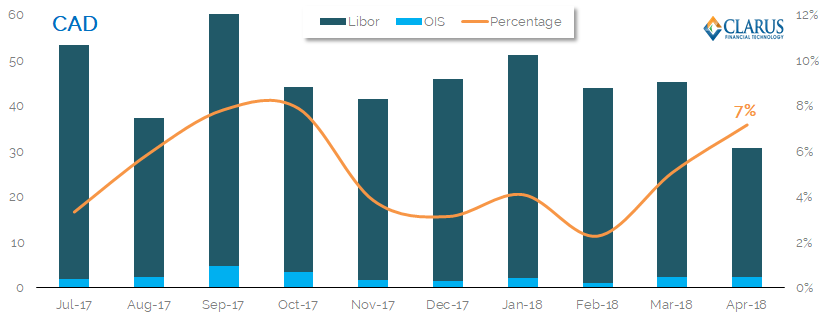
CAD – CORRA trading
 Showing;
- CAD markets are showing North American markets the way to go.
- Adoption of OIS trading seems to be on the increase, and has reached 7% this month.
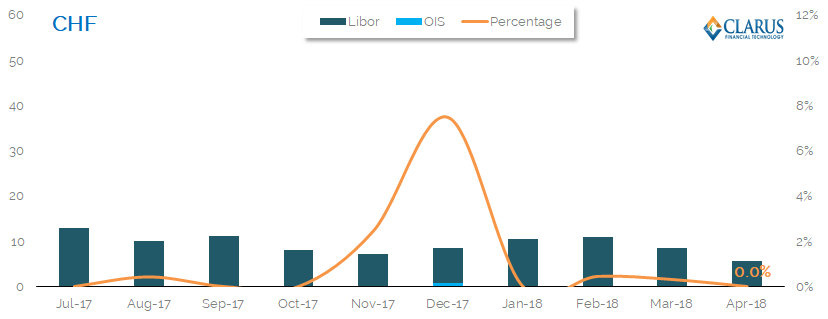
CHF – SARON Trading
And finally;
Showing;
- Despite all of our articles on SARON and it’s introduction, December 17 remains the only month when there was enough SARON trading to register on the LIBOR scale in CHF markets. Remember, this is only for trades reported to US SDRs.
- Therefore, whilst a new, robust RFR exists in Switzerland, the market clearly shows that getting the index in place is only half of the job.
- Liquidity is yet to move from LIBOR to SARON in CHF swaps.
- However, our CCPView data shows that SARON trading continues to increase at LCH.
The Global Picture
We can see that each market is somewhat unique. Our CCPView data allows us to take a step back and look at the global picture too. Unfortunately, we can only do this in terms of notional traded, but it gives us somewhat of an insight into the whole market – not just those trades reported to US SDRs:
Showing;
- Over 50% of notional that is cleared is now OIS (the rest is LIBOR).
- The chart above looks at all IRS and OIS cleared by CCPs across AUD, CAD, CHF, EUR, GBP, JPY and USD markets. It is a much more global data-set than that covered in US SDRs (the source for our previous charts).
- We do not know the tenor of cleared trades – the CCPs do not report this information. Most OIS trades are short-dated, which represent a small amount of risk but a large notional. This is why this chart looks so different to our DV01 calculations in the previous charts. Remember that DV01 is a maturity agnostic measure of risk, allowing us to accurately compare the amount of risk on a one month swap to a 30 year swap.
- We will continue to monitor this in our data as benchmark reforms take hold.
In Summary
- The amount of risk traded as OIS varies from market to market.
- GBP markets lead the way, with 13% of risk traded as OIS. This is on an upward trend.
- EUR markets also have a large liquidity pool in OIS, thanks to an active interbank market.
- In USD, only 5% of risk is traded as OIS. This may be skewed by a larger sample in our data, but it does suggest that benchmark reform here has a long way to go. All eyes on SOFR swaps from here on in!
- In other currencies, CHF has succeeded in introducing a new RFR, and trading continues to pick up in SARON at LCH.
- Globally, over 50% of notional cleared is now OIS. This is distorted artificially higher by short-dated trades. Nonetheless, as benchmark reforms continue, the percentage of trades that are OIS will continue to increase.
GBP the standout in OIS adoption, must be something to do with better market structure, intermediaries and a top benchmark administrator for the last two and a half years … 😉
eee two and a half decades!
I knew you meant two and a half decades Alex….time flies!