The LSE and Deutsche Boerse merger to create one of largest Exchange Groups has generated a lot of press coverage and their respective Clearing Houses, LCH and Eurex, are seen as central to the transaction. (see Bloomberg). In this article I will look at the Public Quantitative Disclosures by LCH and Eurex to learn what these tell us about the proposed merger.
Background
Under the voluntary CPMI-IOSCO Public Quantitative Disclosures by CCPs, over two hundred quantitative data fields covering margin, default resources, credit risk, collateral, liquidity risk and more are published each quarter with a quarterly lag.
Currently two sets of disclosures, for 30 Sep 2015 and 31 Dec 2015, are available in CCPView.
Lets look at some of this data.
Initial Margin
An interesting proxy for the size of a Clearing House is the amount of Initial Margin posted by members.
Looking at this in EUR for Eurex and in GBP for LCH, so FX Rates do not influence the quarterly trend.
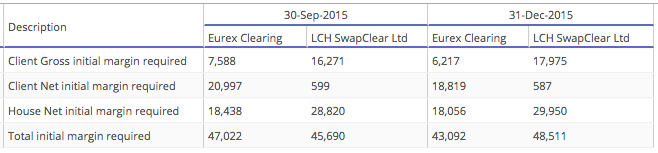
(Generally we will limit ourselves to LCH SwapClear only when looking at LCH).
Showing:
- Eurex Clearing Total IM was €47b on 30 Sep and dropped to €43b on 31-Dec
- A decrease of €4b or 8.5%
- Most of the drop was in Client margin as opposed to House margin
- LCH SwapClear Total IM was £45.7b on 30 Sep and increased to £48.5b on 31-Dec
- An increase of £2.8b or 6%
- More of the increase was in Client margin (£1.7b) vs House margin (£1.1b)
And the same data in USD equivalents, using FX Rates from the respective dates.
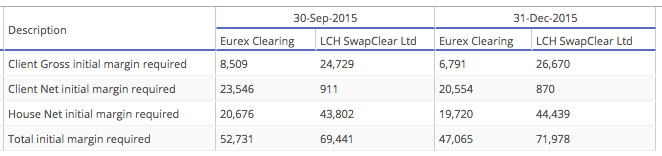
Showing that the Total IM of Eurex and LCH SwapClear combined as of 31-Dec was $119 billion.
Compare this to CME Group, the largest Exchange by market capitalisation.
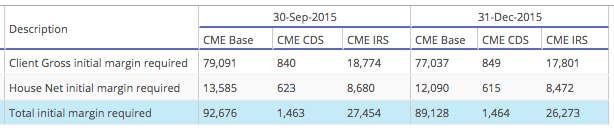
A combined IM for the three CME Clearing Services of $118 billion.
So Eurex Clearing plus LCH SwapClear at $119 billion is the same as this, but adding the other LCH Ltd Services (e.g. RepoClear), takes the combined total to $130 billion. And LCH Clearnet SA has a further $36 billion, making it a grand total $166 billion. (Granted some of this is for other exchanges like Euronext, who may decide to move the business away from a combined DB-LSE group).
Either way $166 billion or $130 billion, these are appreciably bigger numbers than the CME one.
In management statements the CEO of LCH and/or Deutsche Boerse have said that while the two Clearing Houses will remain physically separate, they will offer cross margining benefits to members of both. Meaning that the combined IM will be lower due to these offsets. As the revenue of a Clearing House is not directly linked to Initial Margin, that may not matter too much; though there is a weak(?) link from gains on the invested margin over and above the amount paid on member balances.
A side note from the above table is how much larger CME’s relative proportion of Client IM to House IM is than either Eurex or LCH SwapClear. A function of the difference in US vs Europe or room for much more client growth in Europe? Not sure, but the growth in LCH client margin (and client accounts, see next section) suggests the latter.
Members and Clients
Lets now turn to membership data.
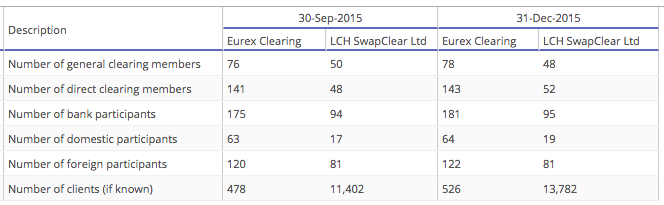
Showing for Eurex Clearing:
- General clearing members increased by two to 78
- Direct clearing members increased by two to 143
- Bank participants increased by six to 181
- Number of clients increased by 48 or 10% to 526
While for LCH SwapClear:
- General clearing members decreased by two to 48
- Direct clearing members increased by four to 52
- Bank participants increased by one to 95
- Number of client accounts increased by 21% to 13,782
Obviously there are going to be many firms that are members of both Eurex and LCH, so an interesting data point is to look at Concentration statistics.
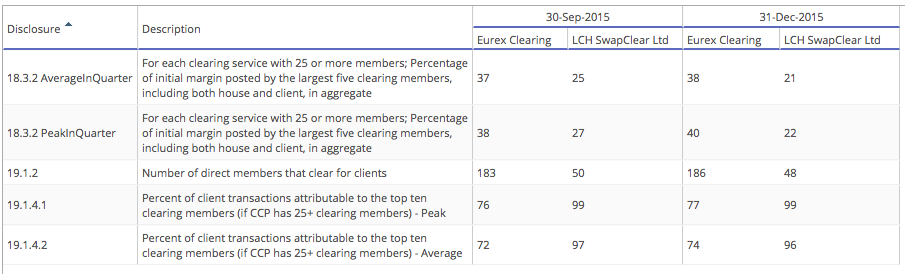
Showing:
- Eurex has a Top 5 member concentration of 38%
- LCH SwapClear has a Top 5 member concentration of 21%
- Surprising as one generally thinks the Swap market is more dominated by Top 5 dealers than Futures
- Or has Futures Clearing just had more years to become commoditised and dominated by firms with scale
- In Client Clearing, Top 10 member concentration is 74% at Eurex and 96% at LCH SwapClear
- Which is more inline with what I would expect comparing Futures vs Swaps
Financial Disclosures
And finally lets take a look at a few Financials.
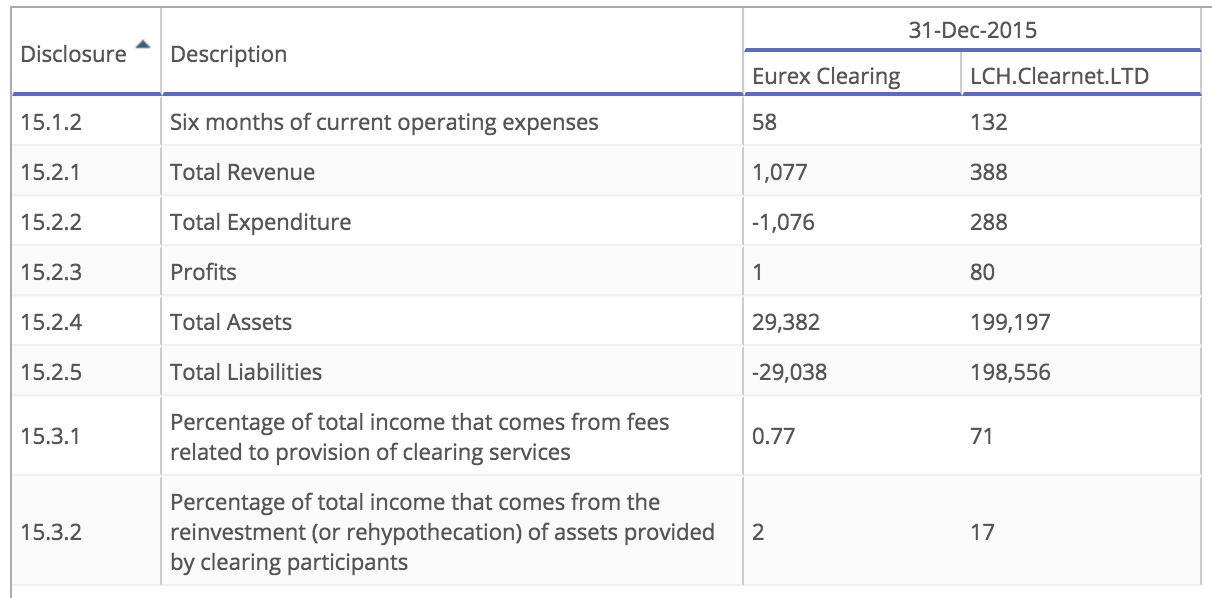
Showing:
- Eurex Clearing Revenue and Expenditure each at $1.1 billion
- Showing no profit from Clearing!
- (Not sure about these numbers, but they are what is disclosed, perhaps some transfer to a Group entity?)
- LCH Ltd with $80m profit on $388 revenue or 20% margin
- LCH Ltd with a Balance Sheet with $199b of Assets
- LCH Ltd with 71% of income from Clearing Fees
- LCH Ltd 17% of Income from reinvestment of assets provided by members
- (So my earlier statement of a weak link of income and IM is not correct)
I am sure there are more recent and more detailed Financials available on the LSEG and Deutsche Boerse websites, but I will let those of you interested to explore for yourself.
Final Thoughts
We can see that the proposed merger of LSE and Deutsche Boerse will create a market leader in Clearing.
CCPView provides detailed data on LCH and Eurex Clearing (Volumes and Disclosures).
With Initial Margin held of $166 billion, a combined entity will be significantly larger than CME Clearing.
LCH SwapCLear is growing strongly in Client Clearing (1Q16 with 22% revenue growth).
And due soon to launch LCH Spider, its new Rates portfolio margining service.
With Eurex Bond Futures to cross-margin with, that would be interesting for EUR Swaps.
And similar to the CME offering in portfolio margining for USD Swaps and Futures.
We will see how the Vertical Integration of Deutsche Boerse plays out vs the Horizontal Integration of LSE.
No doubt shareholders, regulators and member firms will have their say.
And we will find out in due course.