In this article I will look at Q1 2018 Swap Execution Facility (SEF) market share for Credit, Foreign Exchange and Interest Rate Derivative asset classes, in a similar format to my 2017 SEF Market Share Statistics.
Clarus SEFView has daily volume data published by each SEF, which is filtered, normalised and aggregated to allow meaningful comparison of market share statistics.
Summary:
- CRD
- Index, Option and Tranche products
- 1Q 2018 with 69% higher volume than 1Q 2017
- Bloomberg dominates with 78% share
- CDX.NA.IG the largest contract with $270 billion
- FXD
- FX Options at $1.8 trillion, larger than FX NDF with $1.65 trillion
- Bitcoin Futures at CBOE and CME, $10 billion
- In FX NDF, USDBRL is by far the largest currency
- TP-ICAP dominates market share in LatAM currencies
- NEX dominates in Asian currencies
- In FX Options, EURUSD is by far the largest currency pair
- GFI and Tradition the largest in EUR USD
- USDJPY is next, with Tradition and BGC leading
- Four other currency pairs with > $100 billion in the quarter
- Two other currency pairs> $50 billion
- IRD
- Vanilla IRS with $4.7 trillion monthly gross notional
- OIS with $1.9 trillion gross notional
- Other IRD products with $1.1 trillion monthly notional, up from $740 billion in 2017
- Basis Swaps much higher at $448 billion a month, from $235 bilion
- Vanilla IRS market share led by Tradeweb + Dealerweb
- CME-LCH USD Switch trades by Tradition
- OIS Swaps D2D by TP-ICAP
- OIS Swaps D2C by Tradeweb
- Basis Swaps by TP-ICAP
- Cross Currency Basis Swaps, TP-ICAP and BGC very close
- Swaptions, BCC and ICAP, neck and neck
- Inflation Swaps led by BGC
Onto the charts, data and details.
CRD Volumes and Share
Starting with Credit volumes by currency for each month in 1Q 2018 compared to 1Q 2017.
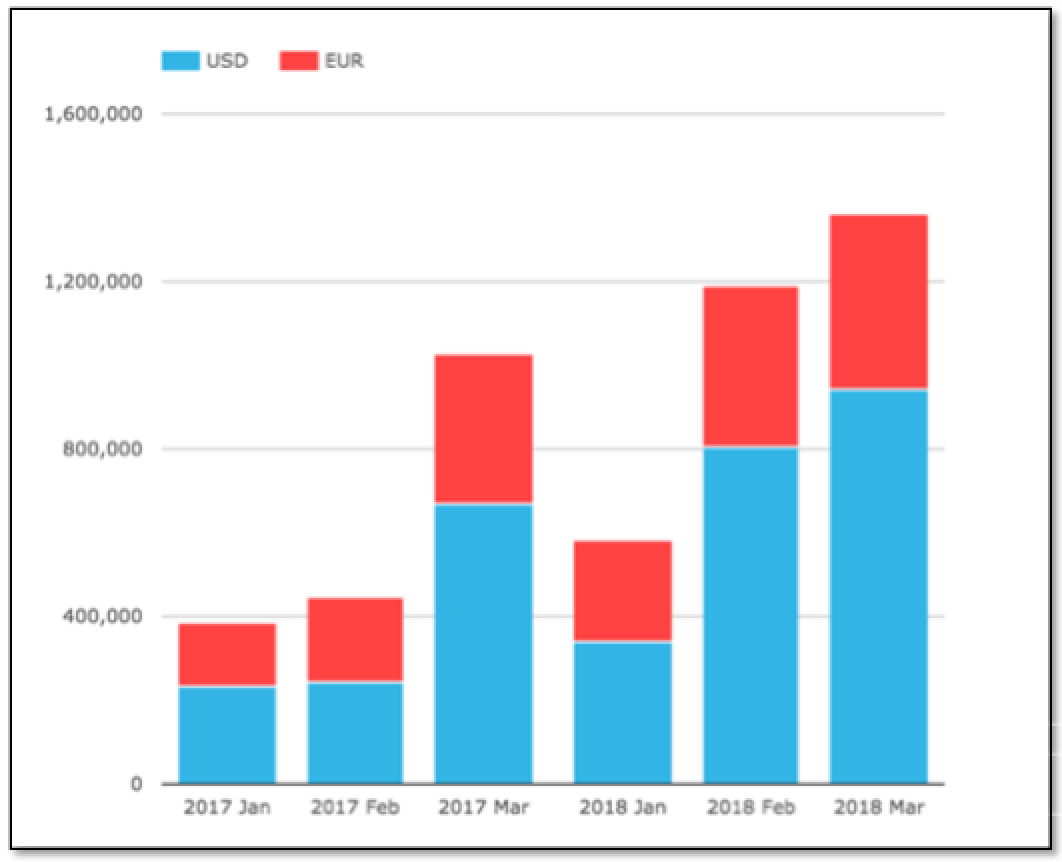
- Each month in 2018 higher than the corresponding month in 2017
- Mar 2018, an index roll month with > $1.35 trillion, a record month for SEFs
- Feb 2018 with almost $1.2 trillion
- 1Q 2018 volume is 69% higher than 1Q 2017
- USD (CDX.NA.IG, CDX.NA.HY, CDX.EM) volume up 82%
- (Recall CFTC SEF rules govern CDS Index not Single-name, so the latter are not included)
Next lets look at a chart of market share for SEFs in 1Q 2018.
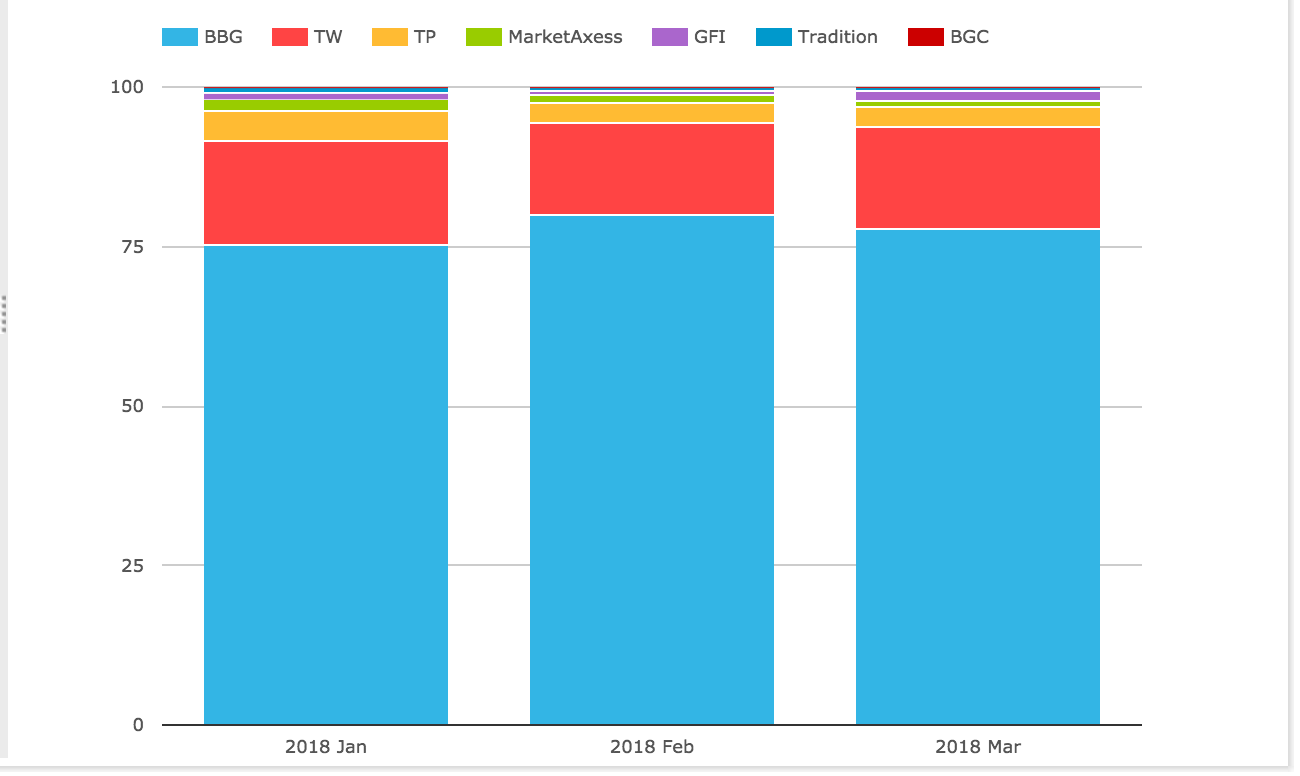
- Bloomberg with a commanding share of 78% for the year, similar to the 2017 average
- Tradeweb is next with 15%
- TP-ICAP with 3.5%
- GFI and MarketAxess each with 1.2%
CDSIndex cumulative volume in the quarter is $3 trillion, while Options volume is $17 billion and Tranche Index just $200 million. Options and Tranche volume is all at TP, GFI or BGC.
And finally for Credit a chart of volume by Index for the major series.

- CDX NA IG S20 is by far the largest with $270 billion
- iTraxx Europe S29 next with $100 billion
- CDX NA HY S30 with $64 billion
- iTraxx EuropeCrossOver S29 with $42 billion
- iTraxx EuropeSeniorFinancial S29 with $16 billion
- CDX EM S29 with $9 billion
Thats all for CRD today.
FXD Volumes and Share
Lets now look at FXD volumes.
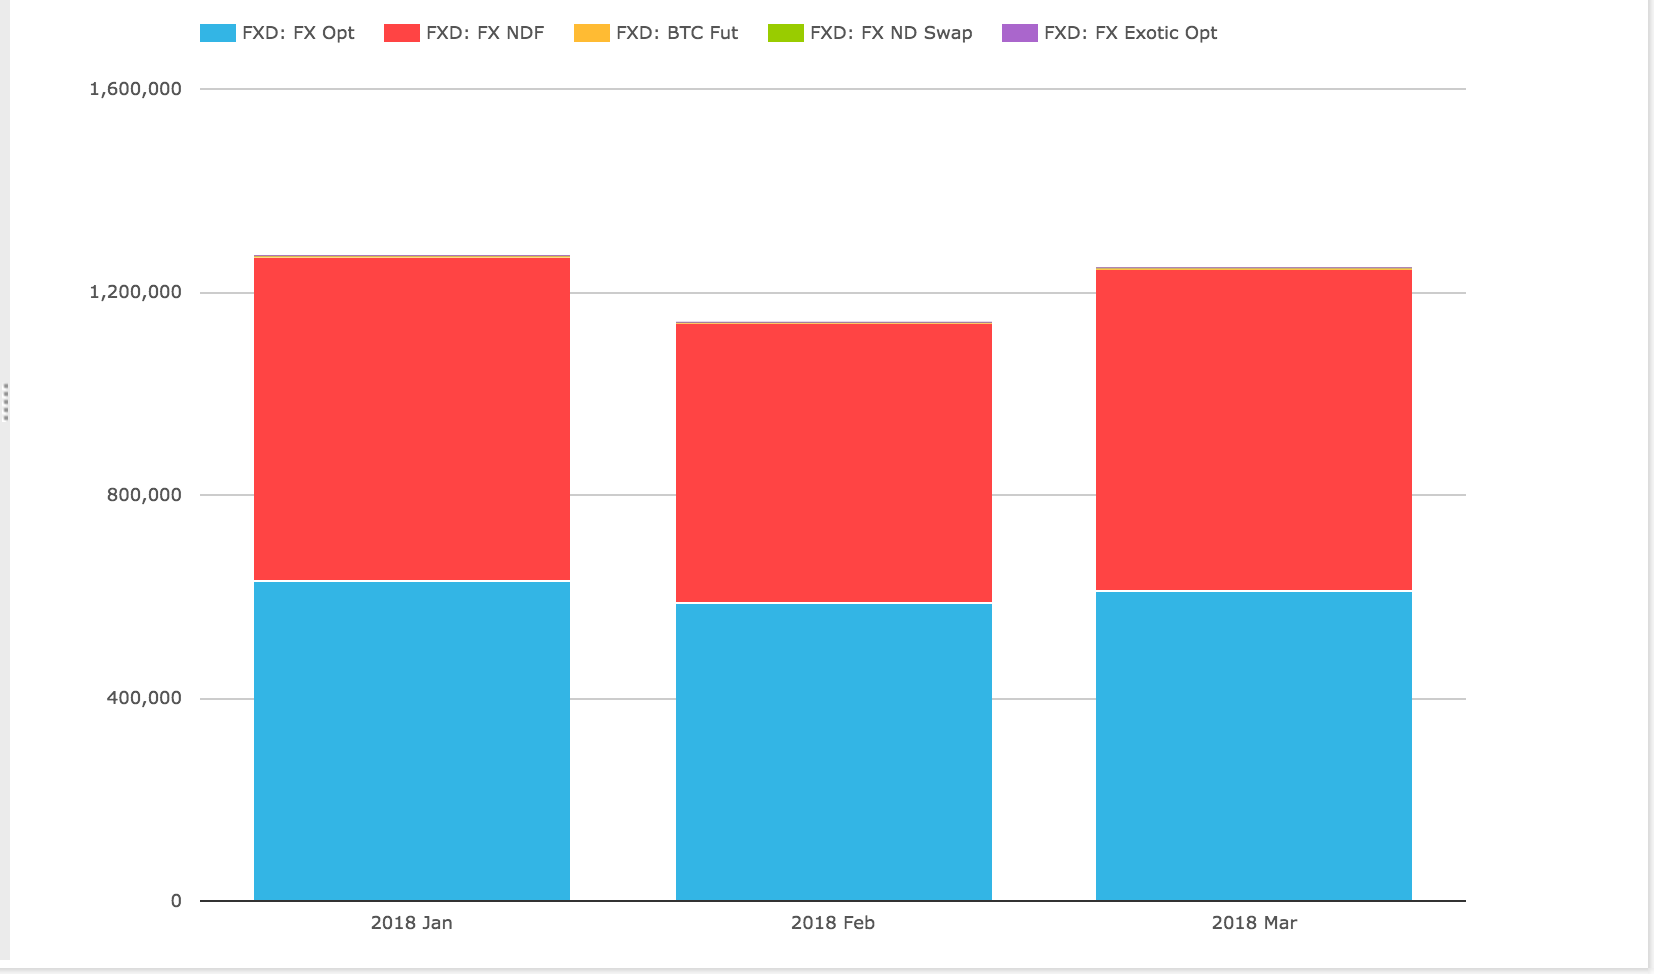
- FX Options has the largest volume with $1.8 trillion
- Non-Deliverable Forwards (NDF) is next with $1.65 trillion
- (In 2017, FX Options was lower than NDF)
- Others are comparatively insignificant
- Bitcoin Futures (at CBOE & CME) were $10 billion
- Non-Deliverable Swaps were $3.7 billion
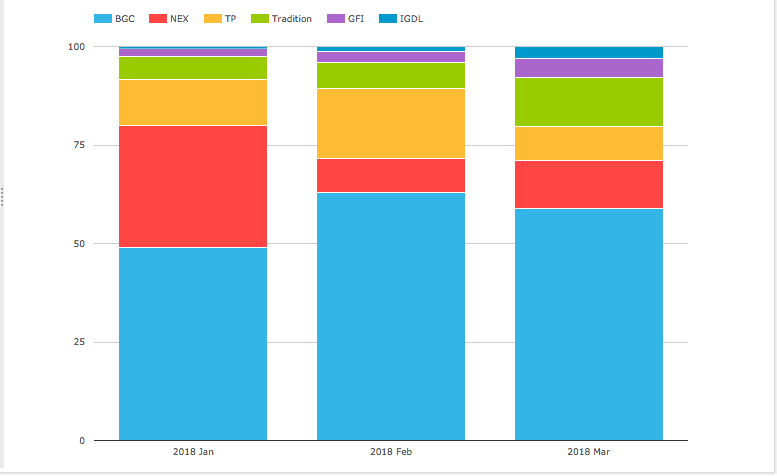
Next FX NDF volumes in 1Q 2018 by currency pair and SEF.
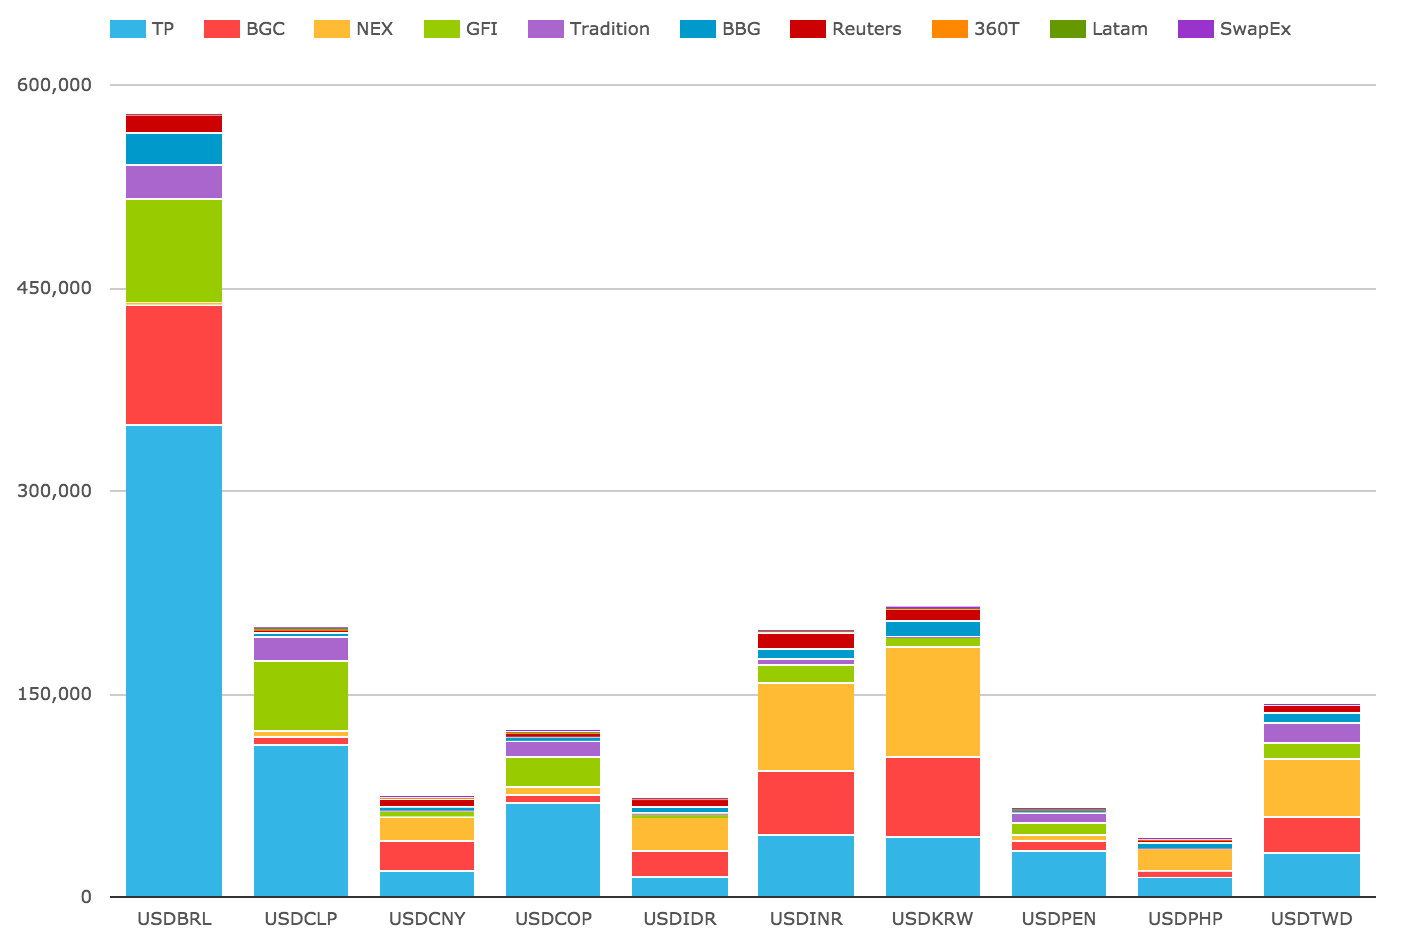
- BRL is by far the largest with $580 billion, in which TP-ICAP dominates with $350 billion
- KRW is next with $215 billion, with NEX the largest at $82 billion
- CLP with $200 billion, in which TP-ICAP has $112 billion
- INR with $197 billion, in which NEX has $64 billion
- TWD is the fifth largest with $143 billion, in which NEX has $44 billion
The market share pattern is that TP-ICAP dominates in LatAm pairs, while NEX dominates in Asian pairs.
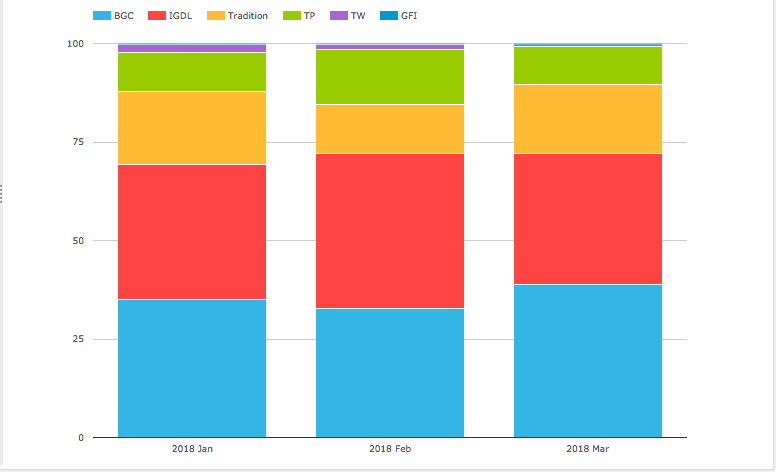
Next FX Options volumes in 1Q 2018 by currency pair and SEF.
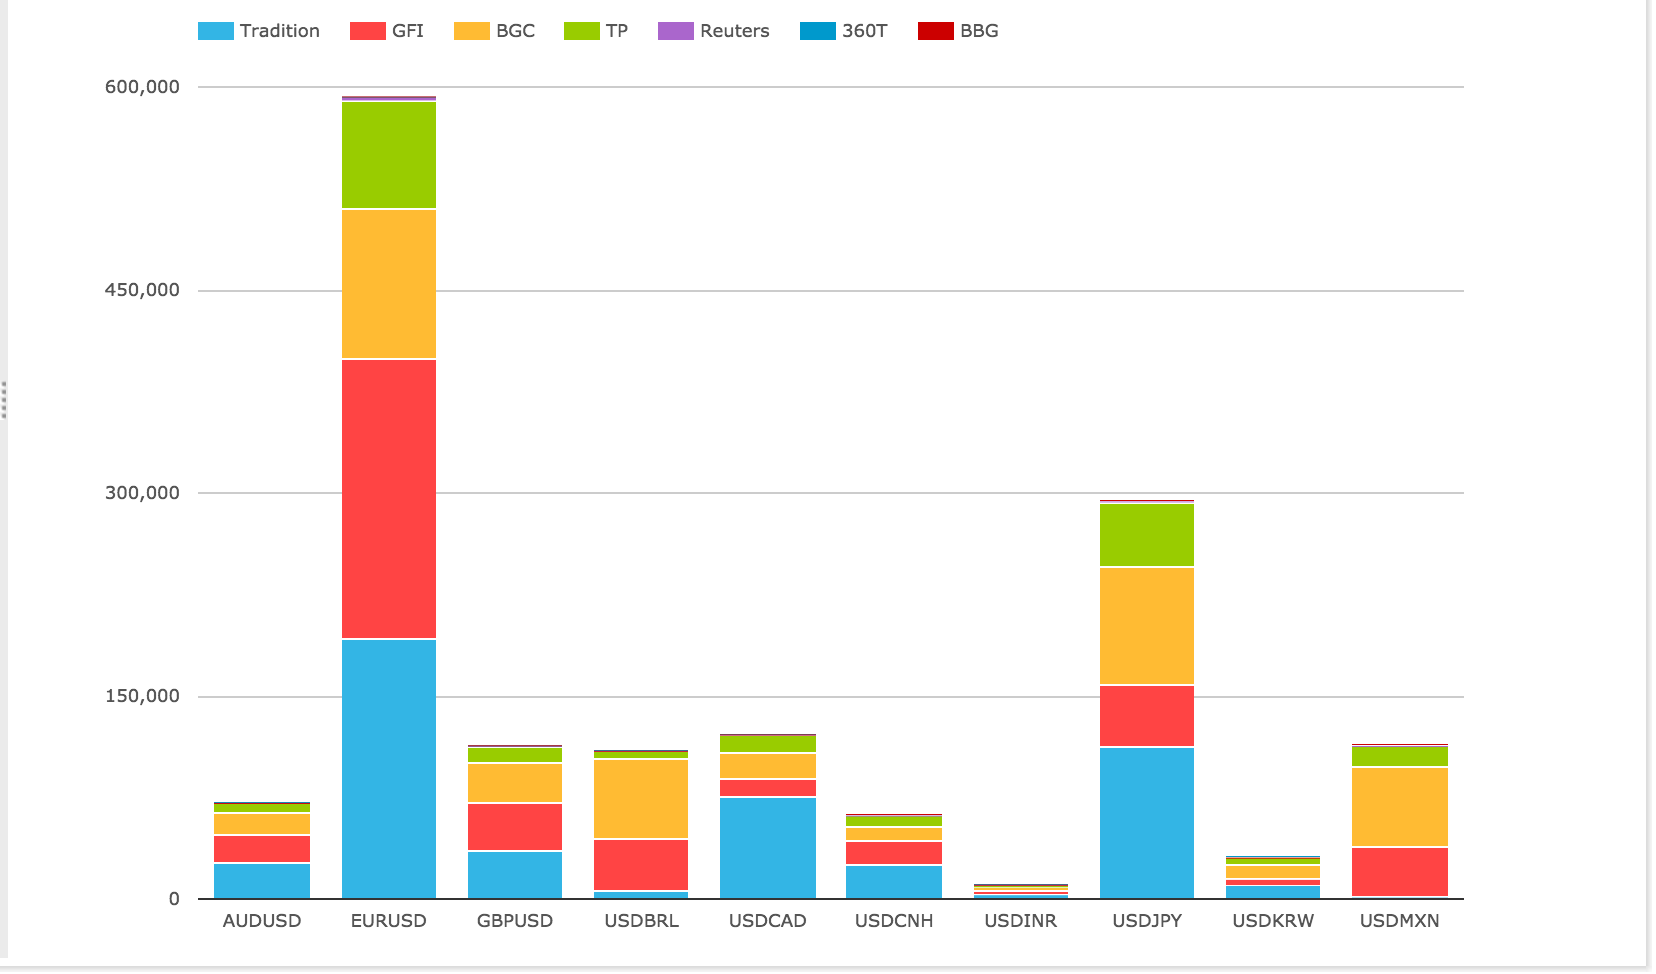
- EURUSD is by far the largest with $590 billion
- GFI with $206 billion and Tradition with $193 billion vying for No 1
- Followed by BGC with $110 billion
- USD JPY is the next largest with $290 billion
- Tradition the largest with $112 billion, followed by BGC with $88 billion
- Four Currency pairs each have around $100 billion volume
- These are GBPUSD, CADUSD, USDBRL and USDMXN
- Next AUDUSD and USD CNH with $70 billion and $60 billion
Tradition and GFI/BGC the largest in FXO.
Thats it for FXD.
IRD Volumes and Share
Finally lets turn to IRD, starting with gross notional by product type.
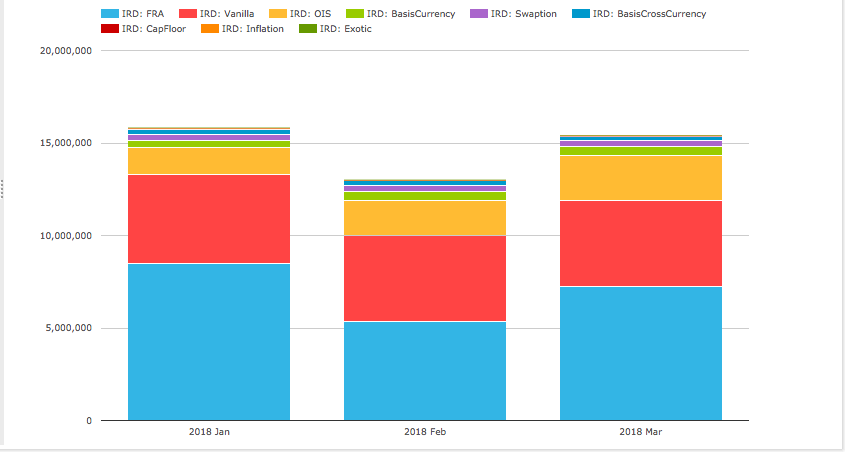
- FRAs are the largest at $21 trillion in the quarter, this is portfolio maintenance activity
- The remaining IRD products were $23 trillion in the quarter or $7.7 trillion a month
- Vanilla IRS averaged $4.7 trillion a month, up from $3 trillion average in 2017
- While OIS averaged $1.9 trillion a month
- Remaining IRD products averaged $1.1 trillion a month, up from $740b monthly average in 2017
- Basis Swaps (single ccy) the largest at $448 billion a month, significantly up from $235b in 2017
- Swaptions next at $313 billion a month, up from $260b in 2017
- Cross Currency Basis Swaps at $268 billion a month, up from $195 billion in 2017
- CapFloors average $30 billion, same as the 2017 monthly average
- Inflation Swaps at $23 billion a month, similar to 2017
- Exotics average $18 billion a month, significantly up from the $3b a month in 2017
Next market share for each product type.
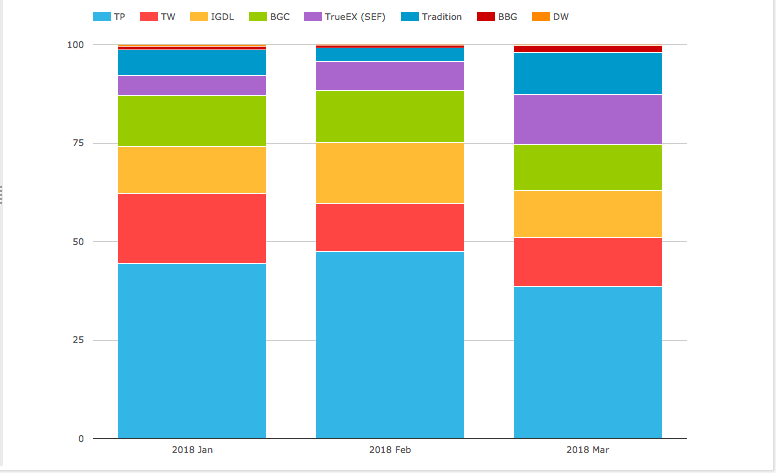
Vanilla IRS
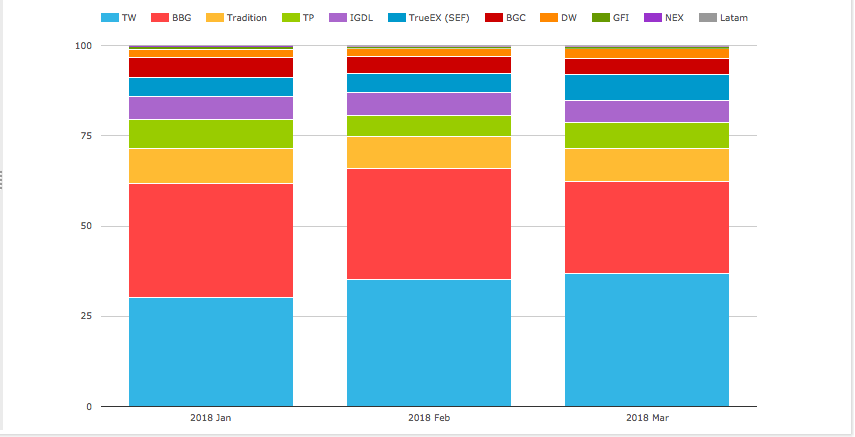
- Tradeweb and Bloomberg vying for top position each month
- Tradeweb with 34% in the lead over Bloomberg with 29.4%
- Tradeweb with Dealerweb (2.4%) combined is 36.4%
- Tradition is next with 9.1%
- IGDL with 6.3%, TP-ICAP with 7%, a combined 13.3%
- TrueEx with 5.9%
- BGC with 4.9%
Note, we provide a free Daily Briefing for USD Swaps and AUD Swaps, you can sign-up here.

CME-LCH USD IRS Switch Trades
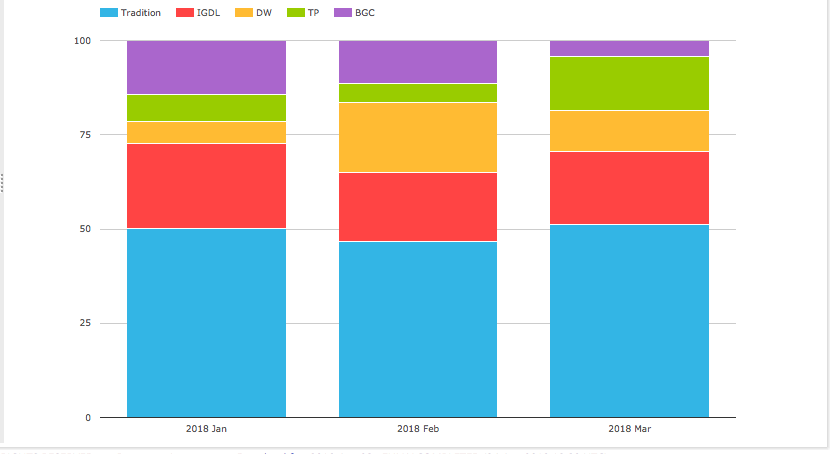
- Tradition in the lead with 50% (up from 41% in 2017)
- IGDL and TP a combined 30% share
- Dealerweb with 11% and BGC 9%
OIS Swaps – D2D SEFs
- TP-ICAP the largest with 51% share
- BGC next with 19%
- IGDL with 18%
- TP-ICAP and IGDL together with 69% share
- Tradition with 12%
- Dealerweb with 0.5%
OIS Swaps – D2C SEFs
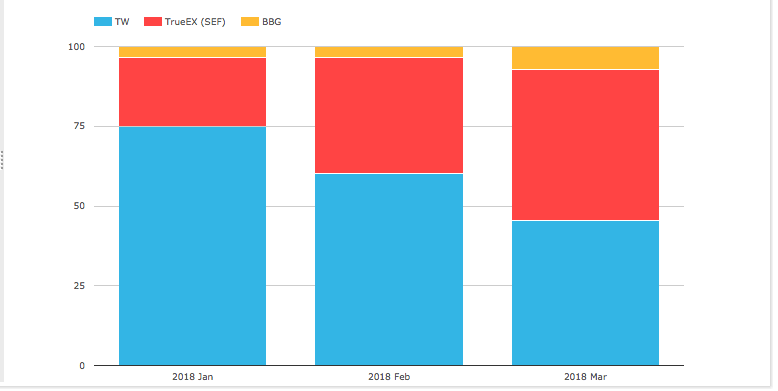
- Tradeweb with 59%
- TrueEx with 36%
- Both with large volumes due to OIS roll/compression (see March 2017 Swaps Review)
- Bloomberg with 5%
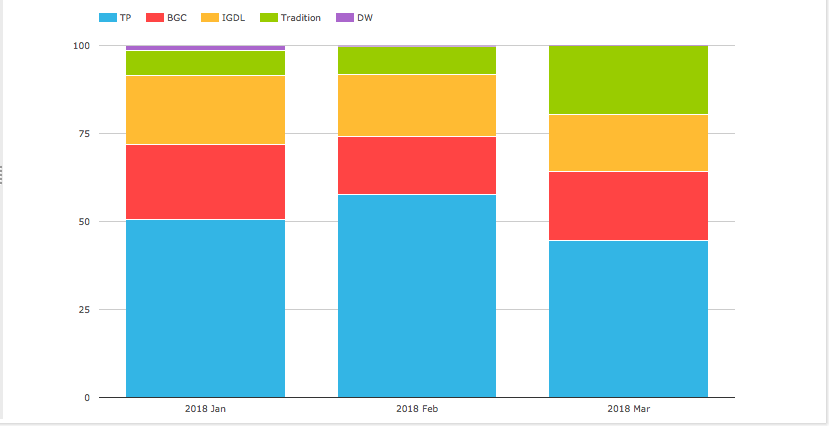
Basis (Single) Currency Swaps
- TP-ICAP with 58% (up from 52% in 2017)
- IGDL with 17% (down form 21% in 2017)
- BGC with 16%
- Tradition with 8%
- Dealerweb with 0.2%
Cross Currency Basis Swaps
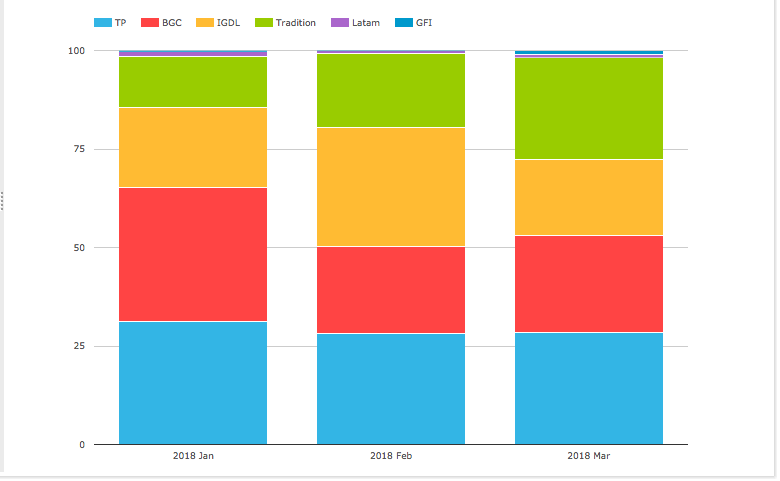
- TP-ICAP the largest with 29% (2017 was 34%)
- BGC next with 27% (up from 23% in 2017)
- IGDL next with 23%
- TP-ICAP and IGDL consolidated is 52%
- Tradition with 19%
Swaptions
- BGC and IGDL in a dead-heat with 35.5% each
- BGC is up from 32% in 2017, IGDL down from 44%
- Tradition with 16%, up from 12% in 2017
- TP-ICAP with 11%, same as 2017
- TP-ICAP + IGDL is 46.5% (was 55% in 2017)
- Tradeweb with 1.3%
Inflation Swaps
- BGC with 56% share (2017 was 70%, 2016 was 58%)
- NEX with 18.3%
- TP-ICAP with 12.8%
- Tradition with 8% (2017 was 15%)
- GFI with 3%
- IGDL with 1.5%
Thats it for IRD.
The End
Thats it, only 15 charts to summarise SEFs in Q1 2018.
I hope you found ones useful to your interest.
If not, using SEFView you can create your own.
It will be interesting to see how 2018 market share develops.
MiFiD II is implemented in Europe and has global implications.
The market expects further rate rises in the US and UK.
What will these mean for volume and market share?
Only time will tell.
We publish regular Swaps Review articles.