Following on from my article on Sizing the Margin Buffer for Cleared Swaps I wanted to look at how a margin buffer sized prior to Trump’s US Election win, would have held up on November 9, 2016 and whether such Event Risk should be handled differently.
USD Swap Rates
We covered the market moves in our article US Election – What is Trading and from that we know that Swap rates were up 25 bps at the long end with the curve steeper, a very significant 1-day shock.
So accounts that were short dv01 (receive fixed) would have faced losses and VM calls.
Lets create such accounts, constructed with hindsight for large losses and see how the buffer performed.
Sample Portfolios
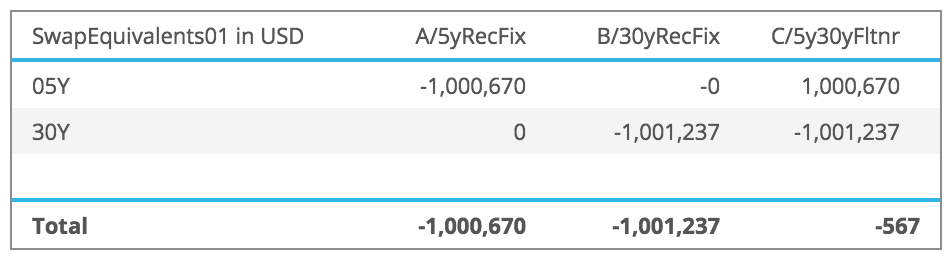
Three USD Swap accounts on Nov 8, with:
- 5Y DV01 of -$1 million (receive fixed)
- 30Y DV01 of -$1 million (receive fixed)
- 5Y DV01 +$1m and 30Y DV01 of -$1m (flattener)
We create these in CHARM and run the Delta risk report as below.
Initial Margin
Next lets use CHARM to calculate CME IM and LCH IM for each of these accounts.
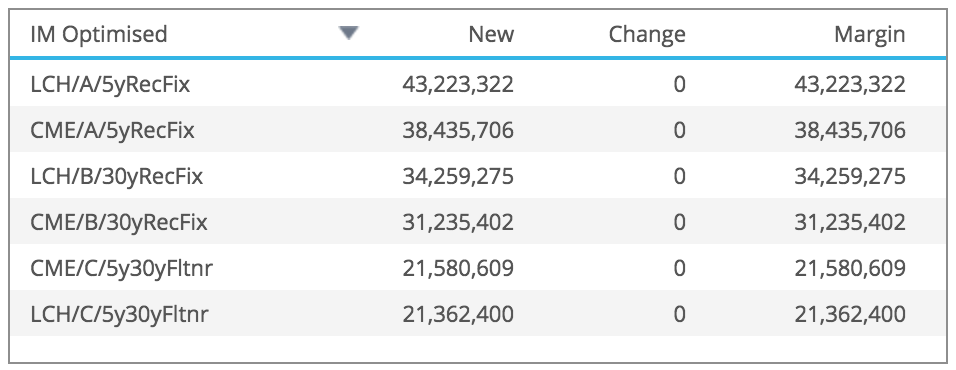
Showing for each Account the IM requirement on Nov 8, which for LCH is $43m, $34m, $21m and for CME $38m, $31m, $22m for the three accounts.
Margin Buffer
In my article Sizing the Margin Buffer for Cleared Swaps, I proposed the method of using Historical Simulation with 1-day returns and Expected Shortfall at 95% confidence level. Lets run this in CHARM to see what margin size buffer we would have held coming into November 9.
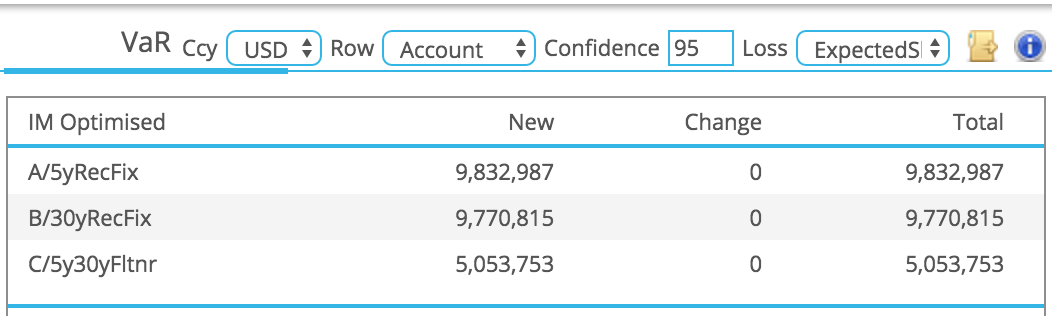
So lets say $10m, $10m and $5m respectively.
VM on Nov 9
And what happened on November 9 when CCPs calculated VM at end of day or made intra-day VM calls?
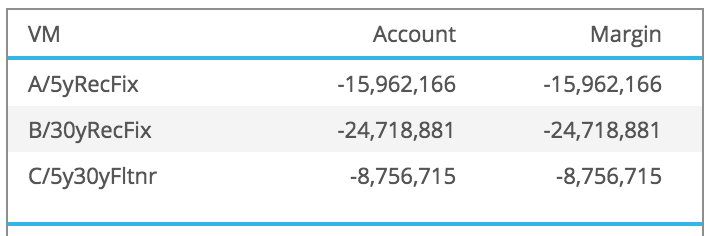
Showing -$16m, -$25m, -$9m, each significantly in excess of the margin buffers of $10m, $10m, $5m; meaning that we would have been scrambling to find the cash to cover the deficit.
What about some of the other measures we considered in the earlier blog?
A higher confidence level, worst case loss or an estimate from the IM. A table of these is shown below.
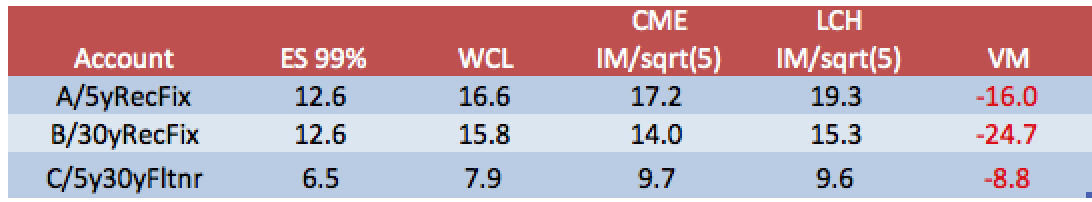
Showing that:
- Expected Shortfall at 99% is still well below VM for each account
- Worst Case Loss would have covered A, but not the others
- CME IM/sqrt(5) would have covered A and C
- LCH IM/sqrt(5) would have covered A and C
- But none of the methods would have covered B (30Y)
So what are we to do?
Event Risk
Well we need to remember that Historical Simulation is not the only tool in our set and it is sound practice to run regular Stress tests for event risk.
In CHARM we can define stress scenarios that shock curves and do so in different ways.
Lets run a few of these, down and up 25bps and flatten and steepen 10bps with 5Y as the pivot point.
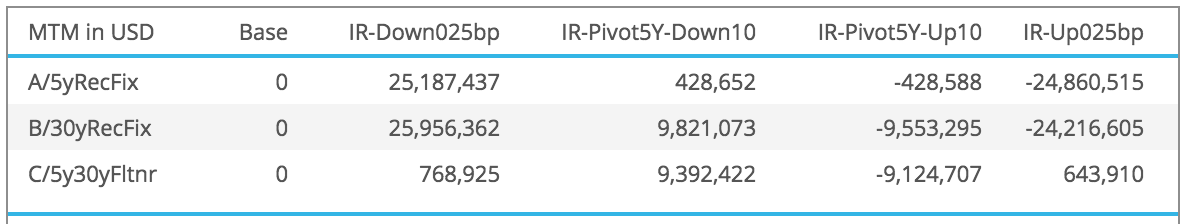
The worst loss across the scenarios for each:
- A would be -$25m
- B would be -$24m
- C would be -$9.5m
Meaning that the VM loss for our 5Y and Flattener accounts would be covered and the 30Y would be very close to being covered.
Recommendation
In light of the above, we would then recommend:
- Using Historical Simulation and ES for the margin buffer
- Plausible but extreme stress scenarios should be defined before events that may result in market shocks (referendums, elections, fed rate decisions) and the results of these used to temporarily increase the buffer
Initial Margin
Another interesting question is whether the large 1-day moves on Nov 9, will turn into large 5-day moves that are significant enough to increase the IM.
Lets look at this, but first given the large change in rates our DV01 risk will also have changed.
Re-running Delta Risk on Nov 14.
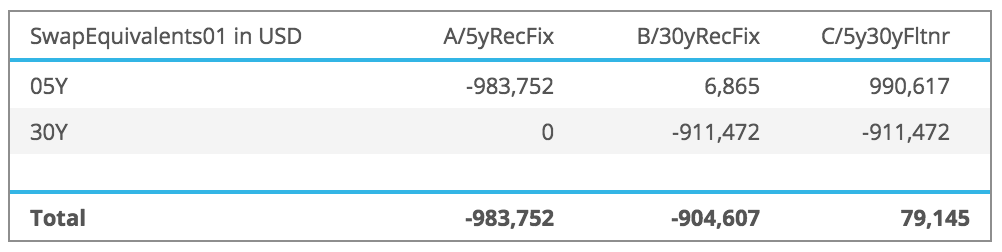
Shows a reduction in negative DV01, by almost 10% for the 30Y and the Flattener account now as a positive DV01. Given this, all else being equal we would expect lower IM.
However not if the 5-day moves that covered the Nov 9 period were big enough to influence the tail.
Lets run the CME IM for 14-Nov.
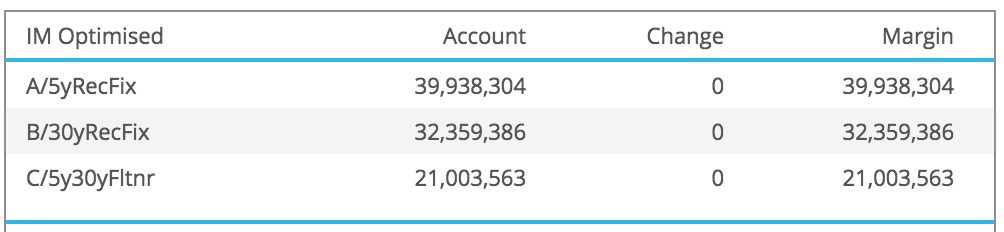
Showing:
- 5Y now has IM of $39.9m compared to $38.4m before
- 30Y now has IM of $32.3m compared to $31.2m before
- Flattener now has IM of $21m compared to $21.6m before
Drilling down on the 30Y we can see the tail loss scenarios
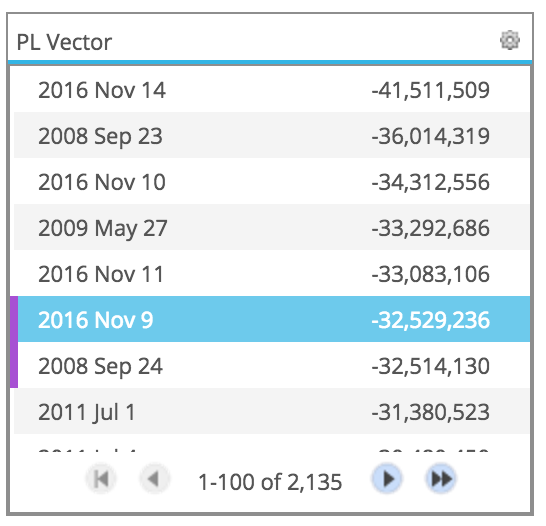
Showing that the worst loss scenario is the 5-day period ending on 14-Nov-2016 and this is 14% greater than the second largest loss. In addition 10-Nov, 11-Nov and 9-Nov are also in the tail, which puts the size of these shocks into perspective and explains the resulting increase in IM.
We could also use CHARM to look at equivalent results for LCH.
However I will stop there for today.