- Uncleared Margin Rules (UMR) for IM have now been in force for one year
- The ISDA Margin Survey 2017 provides a snapshot of IM delivered and received
- $47.2 billion and $46.6 billion respectively, between Phase One firms (March 31, 2017)
- I look at how the figures compare to an $800 billion estimate from 2012
- What factors will increase or decrease them
- And think it unlikely that by Sep 2020, UMR IM will be $800 billion
- One reason being Clearing of more Derivative products
Introduction
In September 2016, I wrote the article “How Large will Initial Margin be for Uncleared Swaps?” , which looked at an estimate in an ISDA paper from November 2012, of $800 billion using approved internal models.
I took the approach of comparing this with the IM held by CCPs for Cleared IRS and CDS ($145 billion) and scaling from a 5-day to a 10-day MPOR to get a figure of $205 billion. Then I noted that for Listed Derivatives IM held was $200 billion and scaling this fro a 2-day to a 10-day MPOR gave $450 billion.
A Grand total of $650 billion, so not far off the $800 billion.
But with a number of caveats and assumptions; should the Listed Derivatives number be included at all and the greater efficiency of multi-lateral netting over bi-lateral netting making comparison error prone.
Now a year later do we have some real numbers?
Yes we do. 🙂
ISDA Margin Survey 2017
This week ISDA released its annual margin survey (available here) and for the first time it included IM required under the new Uncleared Margin Rules (UMR).
For the largest 20 derivatives firms (called Phase One firms), as of March 31, 2017:
- Regulatory IM delivered was $47.2 billion
- Regulatory IM received was $46.6 billion
- A Gross Sum of $94 billion
A big number but still a long way from the $800 billion number!
However given that IM rules kicked in on September 1, 2016, for new trades from that date and the above figures are for March 31, 2017, we have just a six month period of trade activity. No doubt if we had figures as of September 1, 2017, we would see a significant increase in this number.
Dare I say double?
- Possibly, as longer term trades, e.g. 10Y tenors will not have been replaced with trades subject to UMR.
- Possibly not, as the shorter term trades, less than 6M (FX Options, FX NDFs) will be rolling off.
So lets do a classic fudge and call it a 1.5 times increase, $94 billion * 1.5 gives us $141 billion.
The ISDA Margin Survey does give us another set of useful numbers, the Discretionary IM that Phase One firms receive and deliver i.e. with Counterparties not subject to UMR:
- Discretionary IM delivered was $16.3 billion
- Discretionary IM received was $60.5 billion
- A Gross Sum of $76.8 billion
The asymmetry in the delivered and received amounts is due to Phase one firms having many more one-way margin agreements in place.
Assuming all of these counterparties move to two-way and the IM models are similar to Regulatory approved ones (ISDA SIMM), the gross sum we should use is $60.5 billion doubled, so $121 billion.
So we have $121 billion plus $141 billion, a sum of $262 billion to compare the the $800 billion estimate.
Closer but still a long way away.
What Else Will Change?
Well obviously more firms will become subject to UMR, so Phase Two (Sep 2017), Phase Three (Sep 2018), Phase Four (Sep 2019) and finally all firms with $8 billion gross notional in un-cleared derivatives (Sep 2020).
This will result in significant increases in Regulatory IM.
Particularly as the increasing number of bi-lateral agreements serve to further gross up the numbers.
The counter force we see is a migration of some products to Clearing.
Most obvious in FX NDF and Inflation Swaps at LCH, which we have covered here and here. While FX Options Clearing may be the next product to take-off given that both LCH and CME are launching this before end 2017.
So the $800 billion looks a real stretch from where we are now.
Only time will tell.
My gut feel is that with increased levels of Clearing, we won’t see that figure by Sep 2020.
Other ISDA Margin Survey Numbers
There are many interesting charts and figures in the ISDA 2017 Margin Survey, and I would encourage you to read the full document here. The charts I find interesting are copied and pasted below.
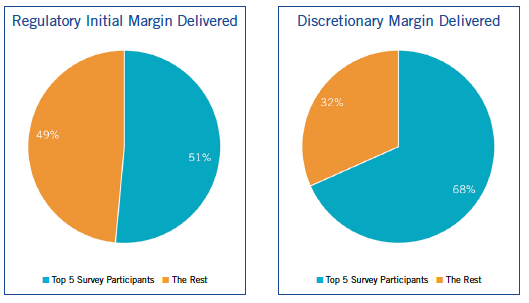
Concentration of IM and the dominance of the top 5 dealers out of the 18 firms reporting.
Dominance of Government Securities as collateral for IM.
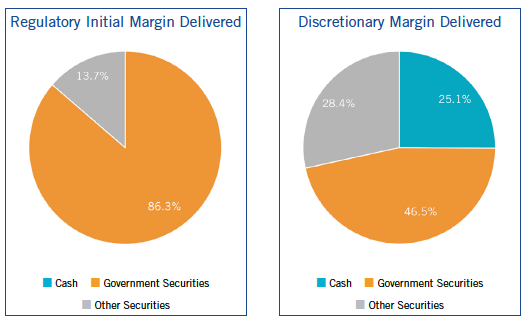
The reason given in the ISDA document is that margin regulations stipulate IM has to be bankruptcy remote, which is much easier to implement using securities.
Variation Margin numbers
The Margin Survey also provides a lot of VM information.
For example VM delivered by phase-one firms totaled $685 billion and VM received by Phase One entities totaled $870.4 billion as of March 31, 2017.
I am unsure what to make of these numbers.
Is VM delivered here the gross sum of each firms daily VM where it was negative (so had to be delivered) to any other firm, summed up for every business day in the six-month period from Sep 2016 to Mar 2017?
And the analogous amount for VM received.
Or is it some other definition?
If the former, while this provides some idea on the size of margin flows between firms, it is not the demand on their cash or securities at a point in time or an indication on the amount of collateral that firms need to haves access to in order to meet their daily VM requirements.
The ISDA Survey then sums these VM numbers with IM numbers to give a measure of collateral posted by the 20 largest participants as a headline number, which personally I find confusing as that is not a measure of the actual collateral posted at a specific point in time and consequently I would not sum them.
Perhaps I have misunderstood something.
I will leave it to you to decide for yourself.
(For the ISDA Margin Survey 2017).