2014
So, it’s that time of year when we look back at 2014, the year that was. We go through the (painful) year-end reviews, give the year a mark out of 10 if you must. Think about all of the tail events you’ve traded through during the year. Those once-in-10,000-lifetime events that seem to occur at least once a quarter if you look hard enough. Oil’s precipitous decline, the Treasury Market Flash Crash, Stevie G’s slip….
This got me thinking (as you do….). What did 2014 look like from a Clearing House perspective? Can we learn anything from the 250ish trading days of recent memory? Given the modern-day financial system was robust enough to have survived these shocks without any systemic crises, can we assume the events of this year were far from any true tail scenarios? Would a (lazy) trader have survived 2014?
Delta-Neutral
Relating this back to my recent blogs, let’s take a hypothetical USD Compression cycle and see how a trader may have coped with it. It is delta-neutral across the curve, but with risk-exposures in a number of buckets. The following risk profile is taken from CHARM’s “Delta Zero” Risk Analysis:
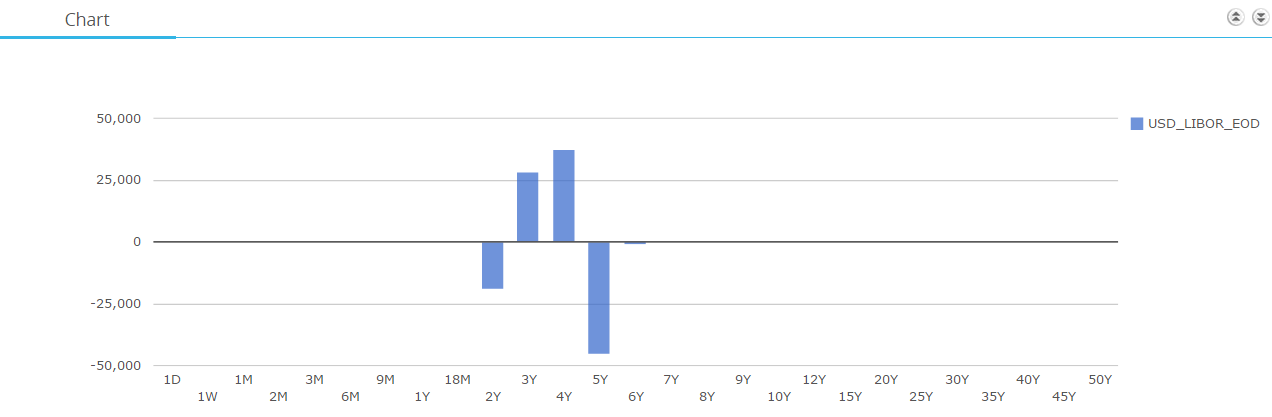
The argument for compression for this portfolio is pretty high. There are line-item and maintenance charges for the swaps. The portfolio has no directional view on rates, therefore the potential upside and/or downside on this portfolio should be limited during normal trading conditions. Add-in the ease of sending an RFQ electronically, with negligible bid-offer spreads from dealers who are under pressure to win your business, and it’s a no-brainer to clean up your portfolio. Plus, you get the Initial Margin related to these swaps back, to reinvest in more lucrative trading strategies. Woo-Hoo!
Lazy Traders
But hey, hold on a moment there. Let’s spare a thought for the poor dealer on the other side of this trade, shall we? His IM requirements may go UP when accepting these trades, never mind trying to hedge it with ever decreasing liquidity. How do you think the dealer will actually cope with this portfolio? Often-times, their only real-world solution is to do nothing. Some call it lazy trading…but let’s go with pragmatic trading seeing as it’s the festive season, shall we? Interestingly, we can use CHARM to look at how that pragmatic trading strategy worked out in 2014….
PnL Scenarios
Using CHARM, we can run the PnL of this portfolio through all of the 2014 scenarios at the LCH. Performing a simple PnL calculation on the Delta ladder (Delta multiplied by change in rates) gives us the PnL on the portfolio for all observations in 2014. And just look at what happened to this poor (lazy/pragmatic) dealer’s PnL during some of the worst trading weeks in 2014:
LCH 2014 Tail Scenarios
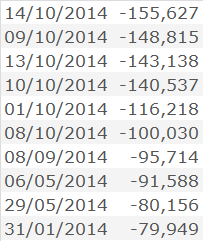
Here’s some descriptive stats for you regarding the performance of this delta neutral portfolio during 2014 – and hence the pragmatic dealer’s PnL:
- The losses were greater than $25k on 64 periods out of 247 observations in 2014
- On “average” (mean and median), the portfolio would have seen PnL swings of +/- $25k per week
- Peak loss was $-155k; peak gain +$215k
Maybe doing nothing wasn’t such a good idea…..and yet we still expect liquidity to be free, and to deal at mid market!
Maybe there’s another way? Let’s use CHARM to look at the same portfolio, for the same trading days, but through the eyes of the CME simulation for 2014:
CME 2014 Tail Scenarios
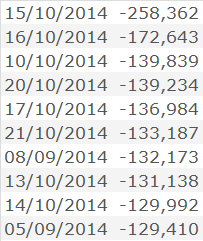
Ouch- it’s even worse! How’s that even possible…. the tail scenarios are clearly much more extreme, such that our pragmatic trader must have hit his stop-losses! As Amir looked at earlier this year, the huge difference is due to the change in methodology employed at the CME – I simplistically think of it as the “Change in Rates” being scaled, relative to outright rates.
Lazy traders the world over must be rejoicing that 2014 didn’t see PnL’s calculated on Shifted Log Returns all of a sudden!
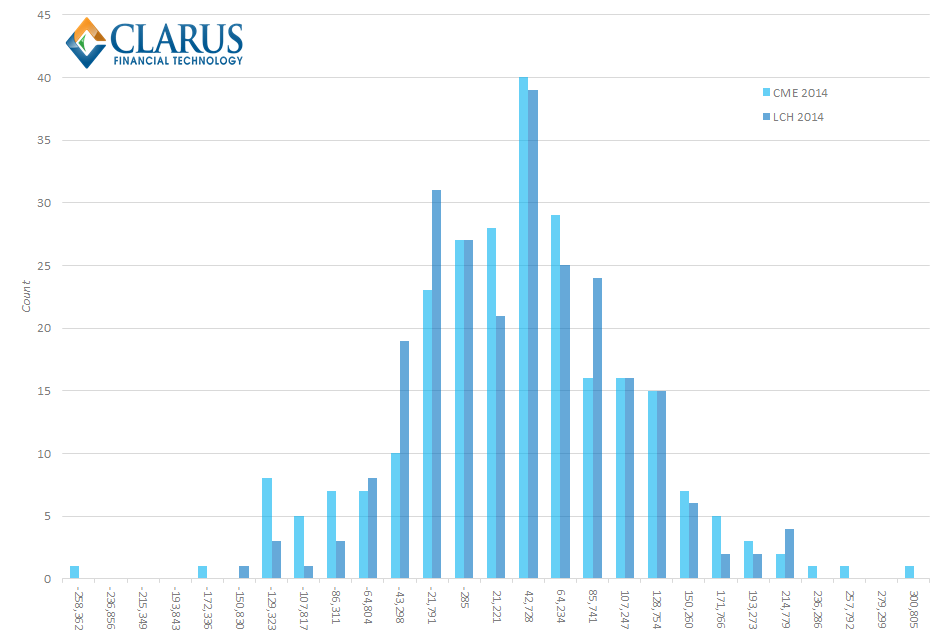
CME vs LCH 2014
If we (briefly) forget about our lazy, sorry pragmatic trader, it is interesting to note how different 2014 can look depending on your perspective. From an LCH versus CME margin perspective, it is clear how much lower and wider the histogram for 2014 is for the CME’s model than LCH – and how much more extreme the tail events are!
2015….
Aside from using 2014 as a trivial way of comparing Clearing House margin models, I want to leave you with a thought for the New Year. What is the actual “IM” of this portfolio? If we choose to clear the portfolio at LCH, CHARM shows us that the IM is $262k:
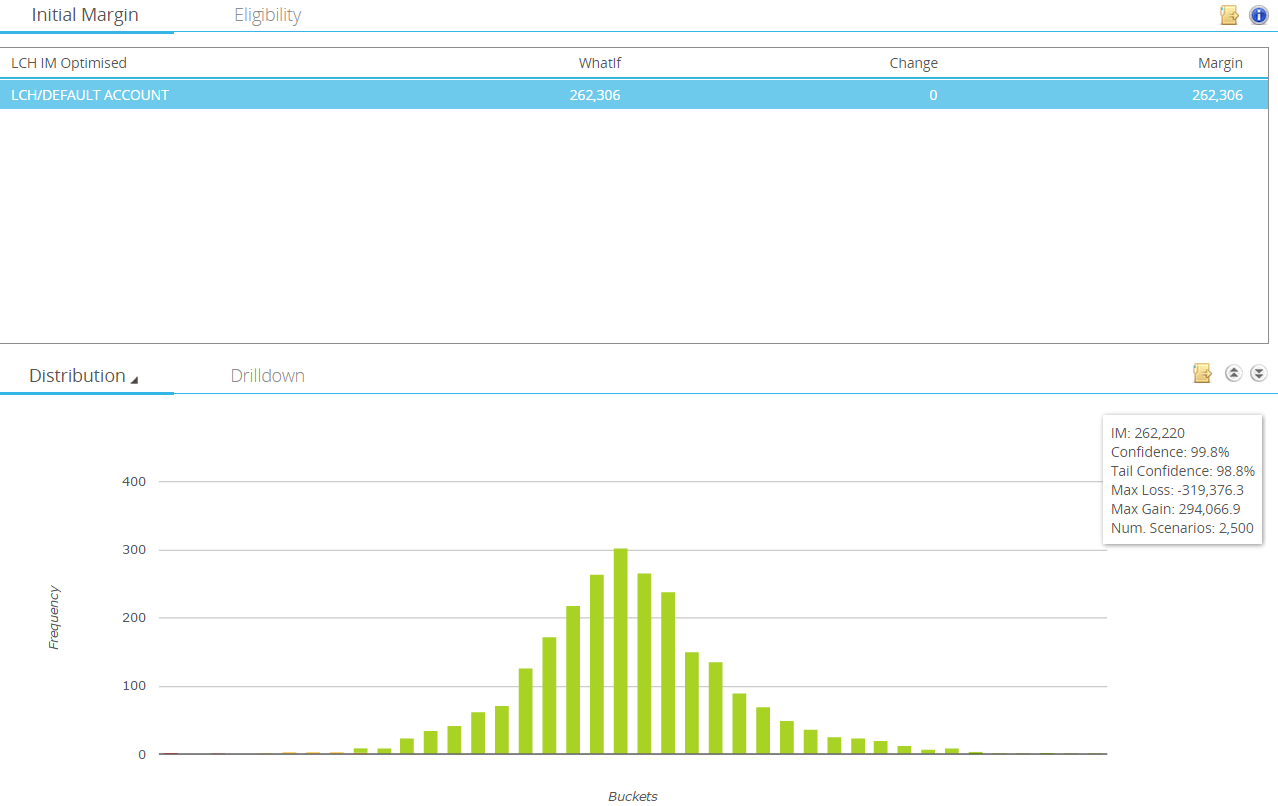
So, that means we need to fund $262k for the life of this portfolio, right?…..right?
Come on, life is never that easy.
So for 2014, I’ll leave you with the thought that in 1 years time, your IM on this portfolio is going to be completely different to today. And no, it won’t be lower. Or even vaguely similar. But that is a story for 2015…..
Happy Holidays and thanks for all of your support in 2014!!