Continuing with our monthly review series, let’s take a look at Interest Rate Swap volumes in May 2016.
First the highlights:
- On SEF USD IRS in May 2016 volume was 10% lower than May 2015
- The lower volumes we saw in April have continued in May
- USD SEF Compression volumes were up from April and similar to May 2015
- USD Swap Curve pivoted up with short rates up 14 bps and long rates down 5 bps
- SEF Compression in EUR Swaps at > $52b is the highest on record
- SEF Market Share has Tradeweb in the lead, driven by very strong compression volumes
- Bloomberg is next, with its lowest share in the past 4 months
- Followed by Tradition, ICAP, Tullet all close together
- CME–LCH Switch volumes at $43b are up from Mar and Apr
- Global Cleared Volumes show similar volume to Apr, so down from Feb & Mar
- LCH SwapClear had 90% share in G4 Swaps in the month
- LCH SwapClear AUD OIS volumes are significantly up again, continuing the YTD trend
Onto the charts, data and details.
USD IRS ON SEF
Using SDRView the gross-notional volume of On SEF USD IRS Fixed vs Float price forming trades (Outrights, SpreadOvers, Curve/Flys).
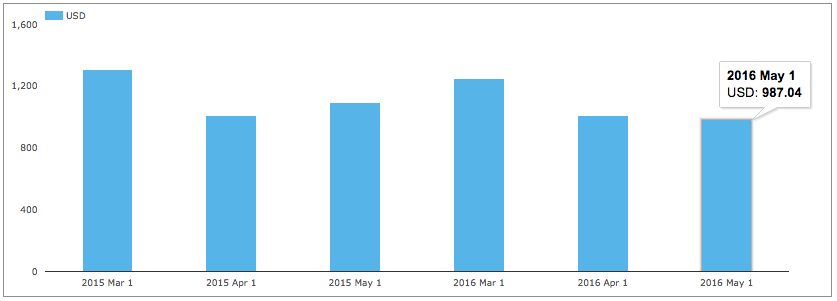
Showing:
- May 2016 gross notional is >$987 billion
- (recall capped trade rules mean this is understated as the full size of block trades is not disclosed)
- 21% lower than March 2016
- 10% lower than May 2015
- So the trend of lower volumes we saw in April has continued in May
And splitting by package type and showing DV01 (adjusted for curves and flys).
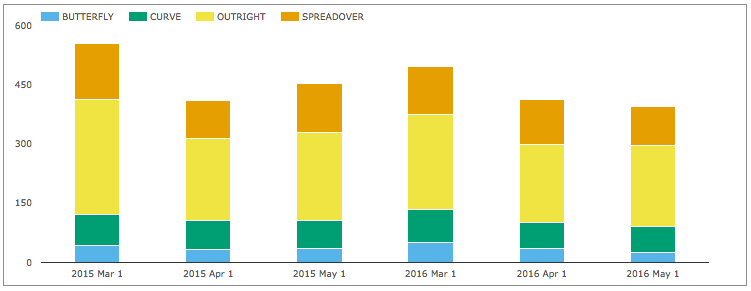
Showing:
- In DV01 terms May 2016 was 20% lower than March 2016
- Overall >$395 million of DV01 was traded in the month
- (recall capped trade rules mean this is understated)
- Compared to May 2015, DV01 is 13% lower
- With the relative percentage of Outrights higher
And gross notional of non-price forming trades; Compression and Rolls.
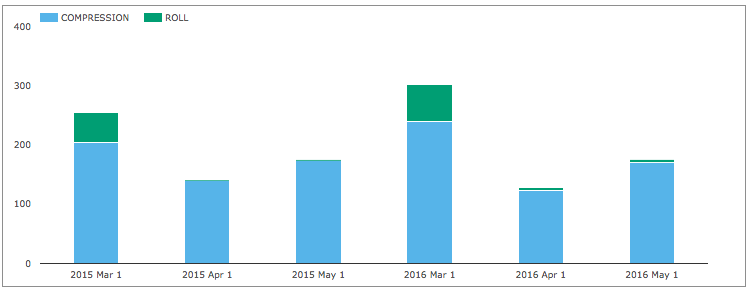
Showing:
- Higher Compression in the month with >$170 billion
- Compared to >$123b in April and $240b in March
- Similar to May 2015
USD IRS OFF SEF
Comparing On SEF vs Off SEF for price forming trades as percentages.

Showing that:
- On SEF vs Off SEF for May 2016 was 60% to 40%,
- Lower than the 64% v 36% in March 2016,
- But higher than the 56% to 44% in May 2015.
USD IRS Prices
Lets now take a look at what happened to USD Swap rates in the month.
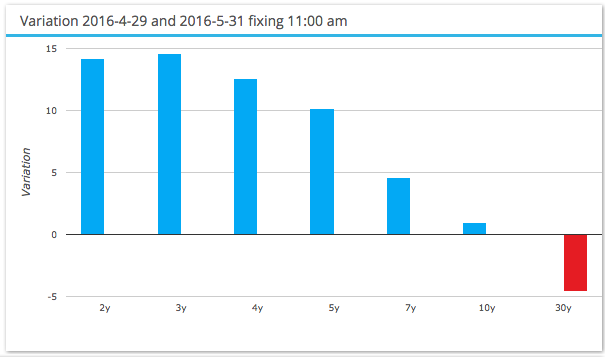
Showing that:
- Swap Curve pivoted Up centred on 10Y
- Short Rates were up 14 bps
- Medium Rates 5 to 10 bps
- 30Y down 5 bps
- Generally the upward trend was a continuation of April and May
EUR, GBP, JPY Swaps
Next On SEF volumes of IRS in the other three major currencies.
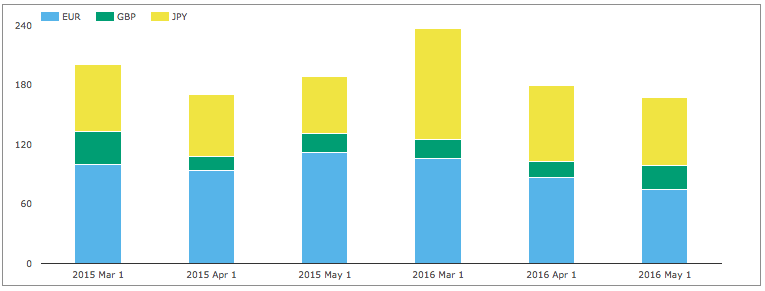
Showing:
- Lower volume compared to April 2016
- With EUR and JPY down and GBP up
- Volumes 11% lower compared to May 2015
The overall gross notional in these currencies of >$168 billion is 17% of the USD volume in May 2016.
And then SEF Compression activity.
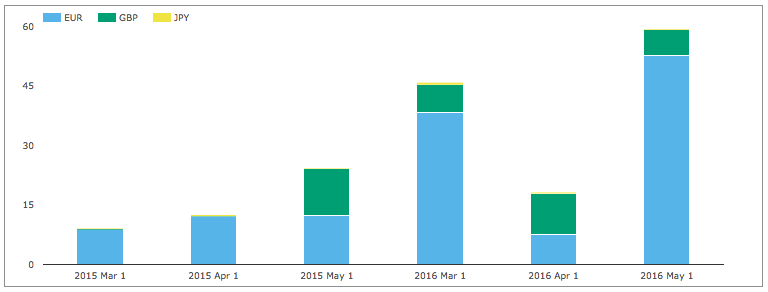
Showing record SEF compression in EUR at > $52 billion, significantly higher than an average month and 36% higher than the previous high of $38b in March 2016.
SEF Market Share
Lets now turn to SEFView and SEF Market Share in IRS including Vanilla, Basis and OIS Swaps.
DV01 (in USD millions) by month for USD, EUR, GBP and by each SEF, including SEF Compression trades and use a chart to compare the relative share in May 2016 with the prior three months.
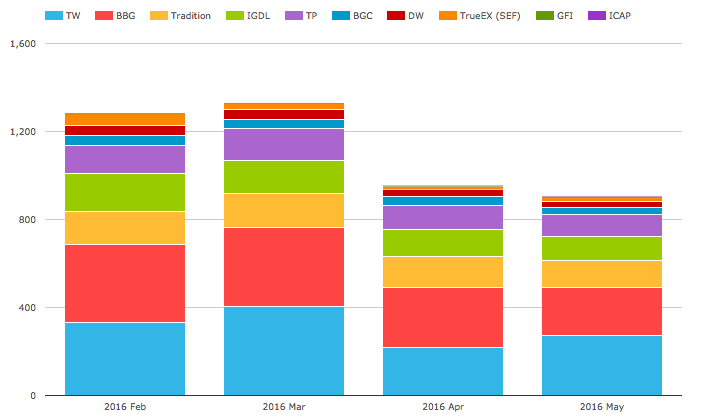
Showing that:
- May volume is lower than April and the lowest YTD
- Not a great month for SEF volumes (as we saw earlier from SDR data)
- Tradeweb overtakes Bloomberg to take top spot with 30%
- (Most likely driven by strong compression volumes in EUR and USD IRS)
- Bloomberg is next highest with 24%, its lowest share in the past 4 months
- Tradition 13%, ICAP 12%, Tullet 11% are each similar to the prior month
- BGC 3.5%, Dealerweb 3.5%, TrueEx 2% are also as in the prior month
CCP Basis Spreads and Volumes
In SEFView we can isolate CME Cleared Swap volume at the major D2D SEFs (on the assumption that this is all CME-LCH Switch trade activity). Lets look at this for the past 4 months.
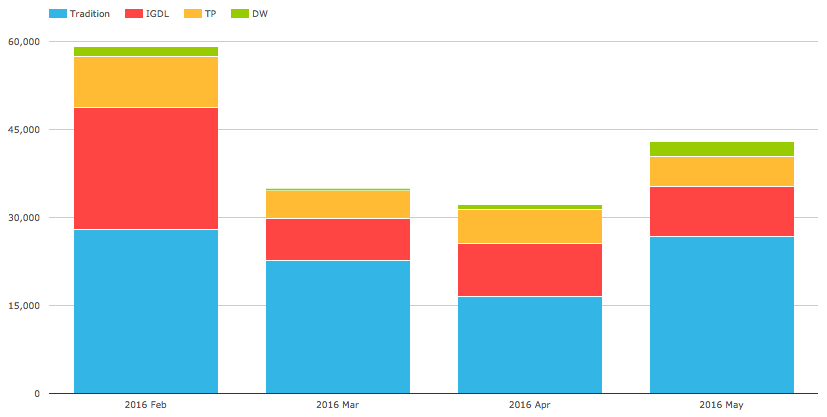
Showing:
- Overall volume in May was $43 billion gross notional
- Up from March and April low $30b figures
- But still below the >$50 billion in Feb
- Tradition has the largest share in the month with 62%
- ICAP is next with 20% and then Tullet with 12%
- Dealerweb showing its highest volume with 6% ($2.5b)
CME-LCH Basis Spreads remained at similar levels to the prior month with 30Y at 3.30 bps.
Global Cleared Volumes
Now onto CCPView to look at Global Cleared Swap Volumes for EUR, GBP, JPY & USD Swaps.
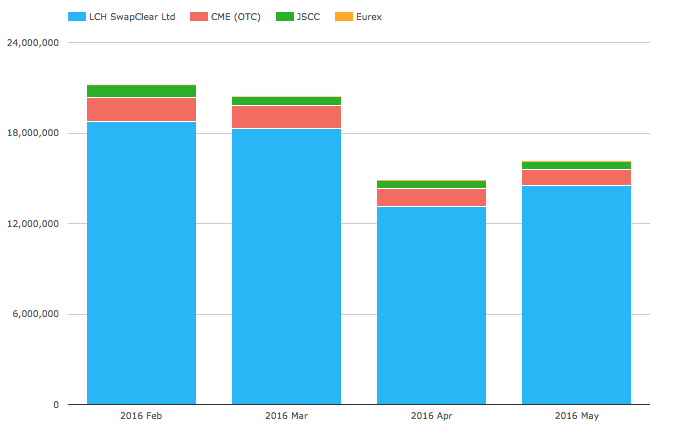
Showing:
- Overall Global Cleared Volumes at similar low levels to April
- (Just as we have seen in US SDR and US SEF data)
- LCH SwapClear volume at $15.4 trillion, is up from its April $13 trillion
- Which at 90% share is it’s highest in this period and up from high 80s
- CME at $1.05 trillion, is similar to its April $1.2 trillion
- JSCC at $500 billion, is the same as April
- Eurex with $70 billion is also the same as April
And last but not least, the volume of AUD, HKD, SGD Swaps (including Vanilla, OIS, Basis, Zero Coupon).
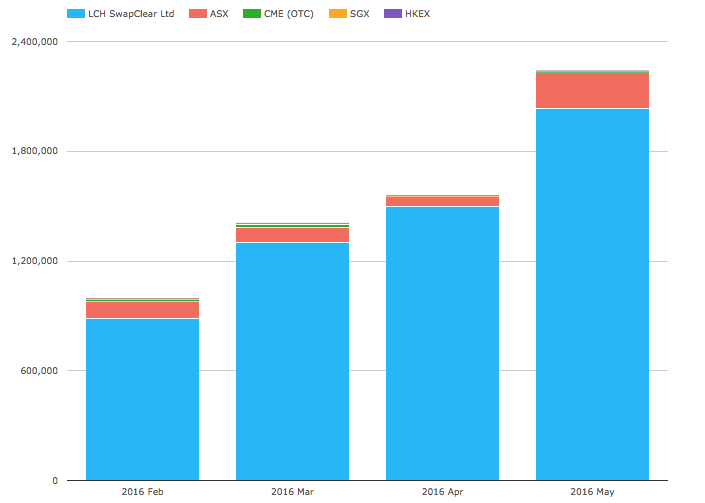
Finally a chart with May higher than prior months!
Showing:
- LCH SwapClear again increasing volume significantly
- Due to a continued increase in AUD OIS volumes
- ASX volumes are also significantly up
- CME and SGX down
- HKEX still very small
Thats it for today.
Thanks for staying to the end.
Our Swaps review series is published monthly.
I’m circling back to the supposition that the CME would provide a better deal in a IRS transaction where I receive fixed and pay 3ml, compared to the same trade with LCH. This implies that the forward swap rates, which determines my future payment obligations, are a little LOWER in the CME forward swap curve points than the equivalent tenor LCH forward swap curves, and assuming that the fixed rate is the same for both the CME and LCH and the OIS discounting factor is almost the same, then the differentiator for the receive fixed trade, has to be by default a LOWER projected payment stream. Or have I got this wrong?
Thanks for the comment. Here’s an example that will hopefully clarify:
Think of a 6 month swap. Assume that 3 month Libor is fixed today at 0.65% on both the LCH and CME curves, and the 6 month basis is plus 0.25 b.p for 6 months. This means that if the 6 month swap is quoted at 0.685% at LCH, it will be 0.6875% at CME. By extension, because the first 3m Libor is fixed at today’s rate on both swaps (0.65%), the 3 month forward at LCH will be roughly 0.72%, whilst it will be 0.725% at CME.
Generally speaking, because the LCH-CME basis is positive, then fixed rates on swaps are higher at CME. This tends to mean that implied forwards will also be higher at CME.