- We focus on Short Term Interest Rate Futures contracts.
- In volatile markets, they are a deep source of liquidity.
- We define the contracts and look at some of their common features.
- Analysing volumes across all Short Term Interest Rate futures is simple in CCPView.
- We find that Short Sterling is more liquid than expected….
- …and that FRA volumes relative to Futures are surprisingly large.
What is a Short Term Interest Rate Future (STIR)?
STIRs are very liquid instruments. They are one of the most important tools for managing interest rate risk. We can broadly define a Short Term Interest Rate future as:
- A cash settled futures contract (i.e. there is no delivery of an underlying asset)
- Settlement in cash occurs on the value date of the reference interest rate.
- Expiry dates are generally on International Monetary Market (IMM) dates (the third Wednesday of March, June, September and December). Australian Bills and New Zealand Bills are notable exceptions. So-called monthly “serial” contracts also exist, typically expiring on the third Wednesday of a non-benchmark month.
- For “T+2” currencies, (such as USD and EUR), the relevant fixing date for the reference interest rate is the Monday before the third Wednesday. For “same-day” currencies (such as GBP and CAD plus other Commonwealth currencies), the relevant fixing date is the third Wednesday itself.
- The price is quoted as 100 minus a reference interest rate.
- The reference interest rate is a 3 month tenor.
- The face value of the contract is normally 1,000,000 of local currency (in JPY it is 100m).
- A move of 1 “tick” or 0.01 on the price of the contract is therefore equal to 25 of local currency. This is simply the non-discounted value of a 1 basis point move in interest rates for three months:
0.01% * 1,000,000 * 90/360 = 25
The contracts are quoted as “100 minus interest rate” so that the price of the contract mirrors the properties of a bond – price up, yield down and vice versa. That’s so that us simple traders don’t get too confused when trading between different instruments!
STIRs at ICE Futures Europe
When ICE bought NYSE Euronext in 2012/13, they also gained control of the LIFFE derivatives exchange in London. LIFFE is an acronym for the London International Financial Futures Exchange. The STIR contracts traded on LIFFE are:
- Euribors, known as ‘Bors. These contracts cash settle at 100 minus the 3 month Euribor fixing.
- Short Sterling. These contracts cash settle at 100 minus the 3 month GBP Libor fixing.
- EuroSwissy. These contracts cash settle at 100 minus the 3 month CHF Libor fixing.
And for completeness sake, the other notable STIRs around the globe are:
- Eurodollars, traded at CME. These contracts cash settle at 100 minus the 3 month USD Libor fixing.
- Euroyen vs TIBOR, traded at SGX and TFX. These contracts cash settle at 100 minus the 3 month JPY Tibor fixing on a notional of JPY100m.
- Aussie Bills, traded at ASX. These contracts are deliverable! Quoted as 100 minus the 3 month AUD BBSW fixing.
- Kiwi Bills, traded at ASX. These contracts cash settle at 100 minus the 3 month NZD BKBM fixing.
STIR Volumes
We’ve been collecting data on CME and Eurex futures for a while. But adding in data from LIFFE allows us to take a proper look at comparative volumes across different STIR contracts. Here are a few take-aways from the volume data:
CME Eurodollar volumes are huge
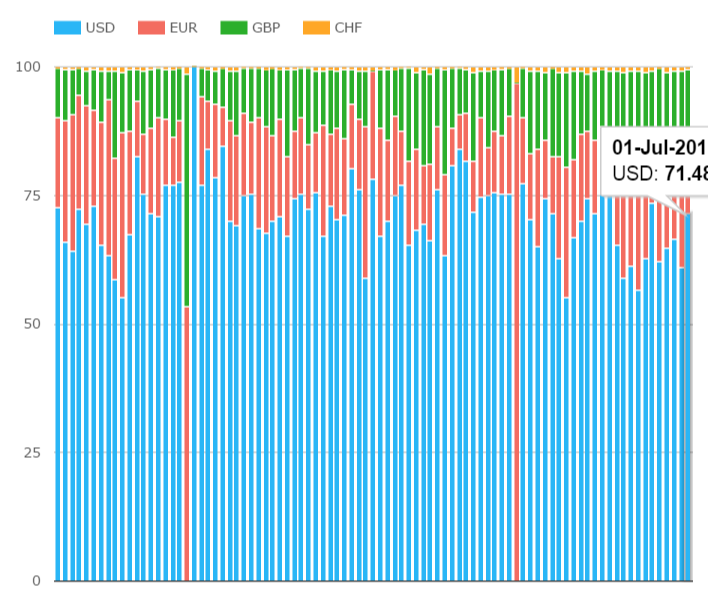
You cannot get away from this fact as soon as you look at the data. Below is the percentage market share of the STIR market by currency:
Showing;
- The chart shows USD-equivalent notional volume traded each day in Eurodollars (USD), Euribors (EUR), Short Sterling (GBP) and Euroswissy (CHF), expressed in percentage of total traded.
- The blue bars, representing USD notional traded (i.e. volume as opposed to Open Interest) dominate.
- As a rule of thumb, CME Eurodollars make up 70-75% of STIR trading on any given trading day.
Euribor volumes are surprisingly small
Ask any trader, and they will confidently assert that Euribors are liquid and Short Sterling is a pig to trade due to a lack of liquidity. I was therefore surprised when I analysed recent volumes for the European STIR contracts:
Showing;
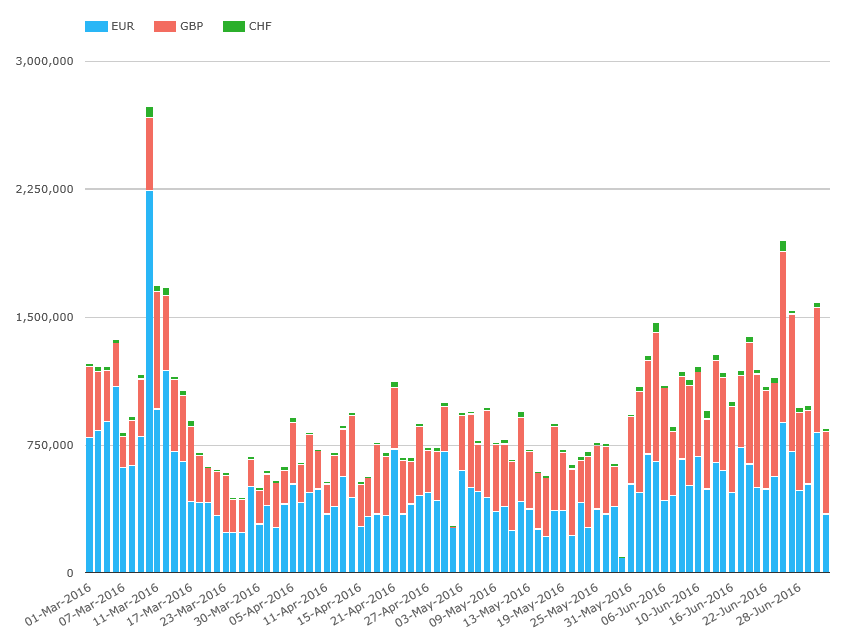
- Volumes, in USD-notional equivalents, traded per day for Euribors (EUR), Short Sterling (GBP) and Euroswissy (CHF).
- Since March this year, the Average Daily Volume of Euribors has been $509bn.
- The ADV of Short Sterling has been $391bn.
- Euroswissy is a long way back at just $21bn.
- Of course, the Short Sterling strip hasn’t (yet) gone above 100. Maybe this has an impact on prices? Lower vol at lower/more negative rates?
Overall, Euribors do see higher trading volumes, but I expected more like a 2:1 ratio with Short Sterling.
BREXIT affected volumes
One of the motivations to include ICE STIR volumes now is to monitor events in GBP markets. June saw elevated volumes in Short Sterling as a result of the referendum:
Showing;
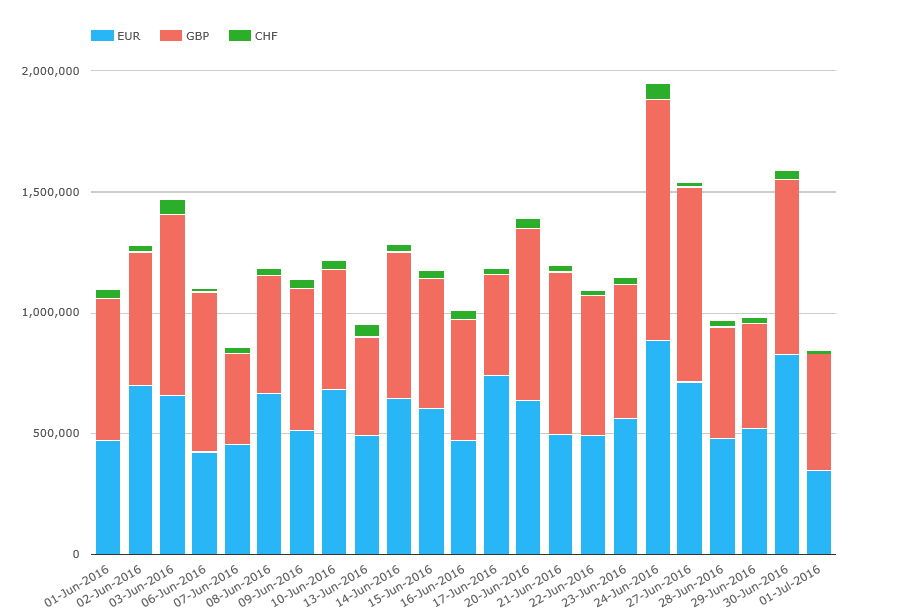
- Volumes, in USD-notional equivalents, traded per day for Euribors (EUR), Short Sterling (GBP) and Euroswissy (CHF) for June 2016.
- Volumes in Short Sterling (in Red) have overtaken Euribors on 11 trading days in June!
- This might be a fleeting phenomenon, but anyone running risk in these products should be aware of these market changes.
And what about the FRA Market?
We can now also compare these STIR future volumes to the FRA markets – especially now that most FRA volumes are cleared. Regular readers will recall that FRA volumes are concentrated into weekly volume-matching sessions run by Reset (ICAP) and tpMatch (Tulletts). So we look at aggregated weekly volumes in the chart below:
Showing;
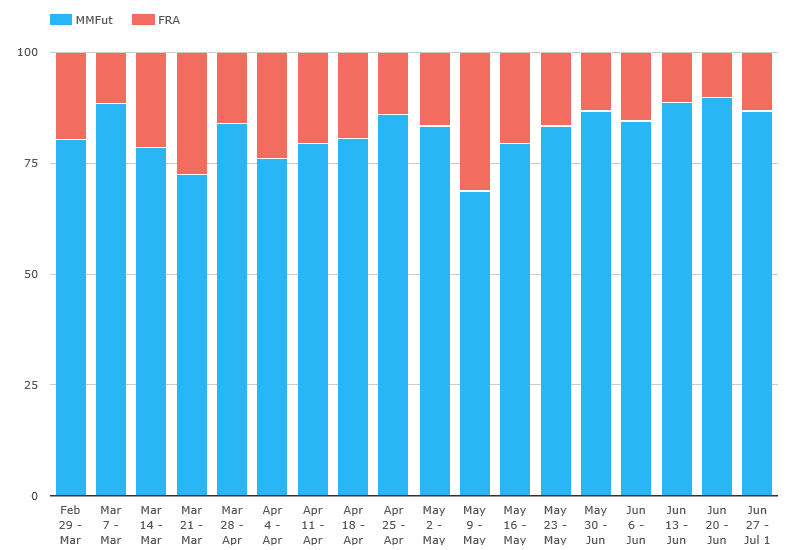
- Aggregated weekly notional amounts of STIR futures (Euribors, Short Sterling and Euroswissy) vs FRAs (EUR, GBP and CHF).
- On average, FRA notional traded makes up around 20% of total short-term interest rate risk.
- This is a much higher percentage than I anticipated. In futures markets there is a lot of risk recycling by liquidity providers, which inflates volumes for a given change in open interest.
- FRA volumes are far more likely to be down to risk management of large swaps desks – akin to “compressing” short dated interest rate risk of swaps with FRAs.
In short – this chart proves that the FRA market is still alive and kicking. If we include USD FRAs and Eurodollars, the relative importance of FRA markets reduces. But FRAs still account for 10-12% by notional per week.
Wrapping Up
We take a look at STIR futures contracts.
We’ve looked at the “major” contracts and have only touched the surface on the exact contracts being offered by various exchanges. We don’t even get to mention new challengers such as NLX (maybe in a future blog?) or the numerous intricacies of the contracts themselves (floating vs fixed tick values for example).
In terms of volumes traded, it is clear that Eurodollars dominate.
But Short Sterling is now the second most active STIR future.
Anyone running risk in STIRs should be aware of increasing volumes (liquidity?) in Short Sterling, particularly relative to the Euribor market.
As we have discussed at length before, we are not necessarily happy to draw a conclusion that increased volumes results in increased liquidity. It’s a fair bet that Short Sterling will have seen greater price dispersion this past month than Euribors.
Nonetheless, it is important to use all of the data available to inform risk taking.
And in light of this, it is surprising to see how significant the FRA markets continue to be in terms of volumes.
It is therefore worth noting that we have an unexpectedly deep insight into the FRA markets as exact prices and notionals are reported to the SDRs. I wonder how many STIR futures participants really make maximum use of that data?
Please allow a request.
Be consistent in your colouring. Blue is $ in the first chart, then €. Red is € then £. Green is £ then CHF. That is needless confusion.
Perhaps always use as follows:
$: black (most important currency, maximum contrast);
€: pink (neutral between the eurozone flags none of which contain pink);
£: blue (flag colour);
CHF: red (flag);
CAD: gold (in Canadian soil);
AUD: green (rugby colour).
But whatever colours you choose, choose them once and then use them for all articles. It would help the readers.
And then use different colours, or at least different variations of the colours, for other purposes. Perhaps FRA = dark grey; future = light grey. In so far as possible be consistent within a page, but do avoid re-using currency colours.
Thanks for the comment, you are entirely right.
In our defense, the apps that generate the charts have to deal with thousands of permutations from a chart view-point. This is a result of allowing user-directed analysis, instead of pre-programmed queries. If we started hard-coding colours and currencies, it would lead us down a merry path of maintaining static data which isn’t very elegant. So at the moment, we allow the chart generator to auto-allocate colours.
We also have to pay consideration to the precise colour-palette so that it is colour-blind friendly. We don’t want to bamboozle 5% (10% of the male) population!
Forgot about the colour-blind: good call.
Could the chart routine recognise whether labels are from the main ISO4217 codes, and if most series are, fetch from a table of colours? That feels like a small burden. (Of course, that feels like a small burden because it isn’t my software and I wouldn’t have to code it.)