MiFID II Best Execution RTS27, requires Trading Venuesand Systemic Internalisers (SIs) to make public relevant data on the execution quality for financial instruments subject to the trading obligation.
This data is published quarterly, with a quarterly lag, so the Best Execution reports for 1Q 2018 are now available from many MTFs, OTFs and SIs. In this article I will take a look at real RTS27 data from the ICAP I-SWAP venue to understand what this data shows.
If you need a refresher on this topic, please see Best Execution for Derivatives.
I-Swap MTF
The TP ICAP website provides access to Best Execution reporting for I-Swap Euro (MTF) ISWA and many other TP ICAP venues (see here).
Within ISWA there are two distinct sets of RTS27 reports for:
- ISWR, which is the Targeted Streaming/RFQ venue
- ISWC, which is the Order Book venue
The good news is these reports are available in csv format, so easily downloadable and usable in Excel.
Summary of the RTS 27 Tables
First lets remind ourselves on the nine tables of information that are published.
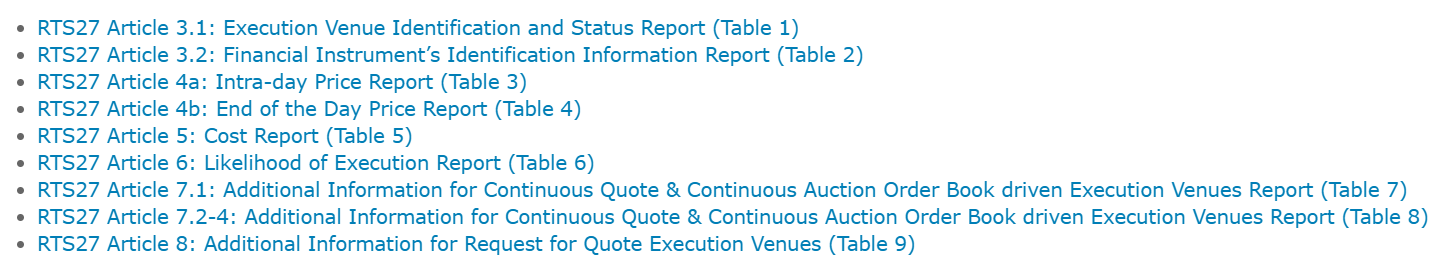
And then look at each of these in turn.
Table 1
Starting with Table 1, which provides general information on the venue.
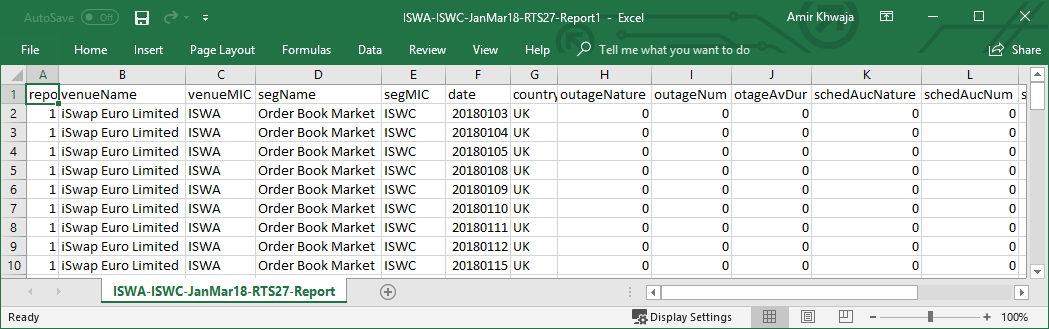
In this case, we see a row for each business day in 1Q 2018, in this case 62, with metrics on any outages, scheduled auctions, failed transactions, which are all zero, so nothing to worry about or of consequence in here.
Table 2
Table 2 is more interesting in that it lists each financial instrument on the venue.
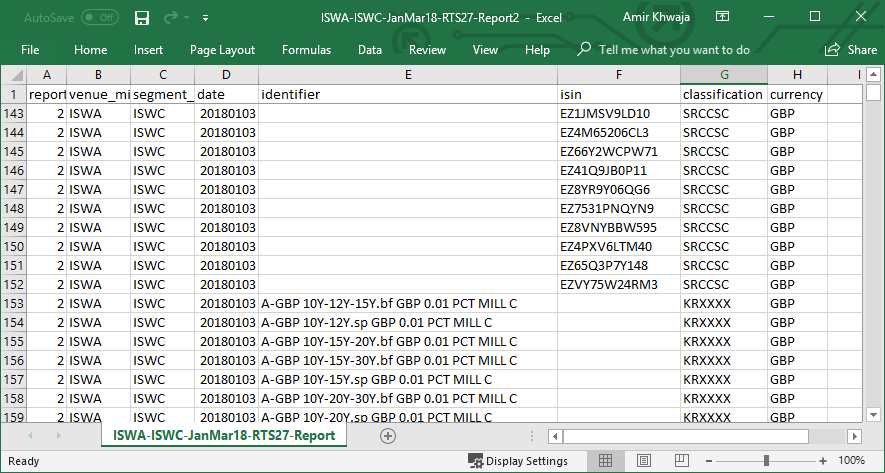
The file has 22,111 rows as it lists for each trading day the financial instruments available and again brings to the fore my long running bug bear about why ISINs are bad for Derivatives.
Degressing slightly from the topic at hand, I note that the DSD-ANNA website now shows the following:
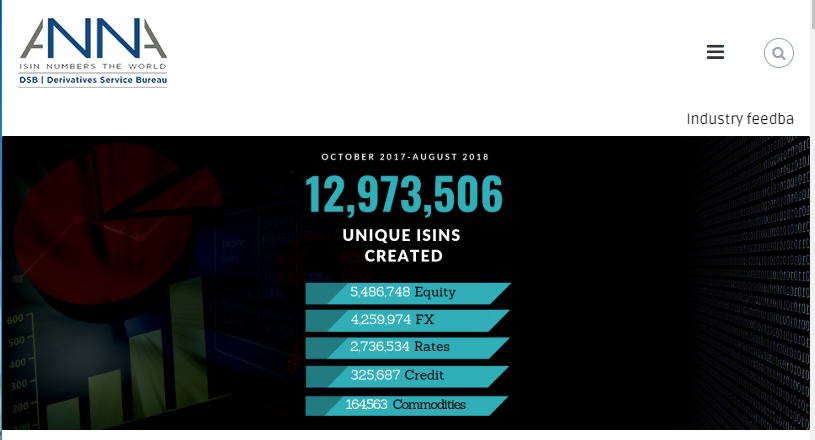
Almost 13 million ISINs created in under a year, with 2.7 million for Rates derivatives!
Now I don’t blame DSB-ANNA, they are simply following an ESMA guideline, but someone at ESMA really needs to do something about this explosion in ISINs by changing the reference data specification! Why not have an industry consultation to invite feedback or do we need to wait for 2020 and who knows what number of ISINs we will get to by then, any takers at 40 million?
Anyway back to Table 2.
On each row we see either an ISIN or a text identifier, a classification and a currency.
Examining the first row, the classification uses CFI Codes and SRCCSC tells us it is a Rates Swap, Fixed-Floating, Constant Notional, Single-Currency, Cash delivery. Great that narrows it down.
Currency is the ISO Code – no lookup needed there (the advantage of a human understandable taxonomy).
The ISIN, we can look up on the DSB-ANNA site or as I prefer using a Clarus Microservice to do a quick search in a table with 2.7 million or 13 million rows:
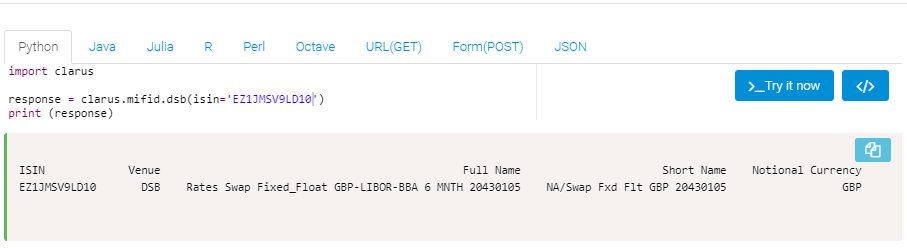
The full name and short name, further corroborates what the CFI Code tells us and in addition that the reference index is Libor 6M and a maturity date. As the date in the row in table 2 is 20180103 and here we see 204300105, I can infer that this is a 25 year trade, so BPSW25 in Bloomberg ticker speak.
Now unfortunately if were to scroll down in Table 2 to the next business date, 20180104, I am not going to find EZ1JMSV9LD10 but an entirely new ISIN, which I need to resolve to figure out if it is the same as BPSW25.
ESMA – I know I have mentioned this before, but tenors over dates would be a really big help and make everyone’s like simpler.
Lets move onto the first row with an identifier and not an ISIN.
The identifier string of “A-GBP 10Y-12Y-15Y.bf GBP 0.01 PCT MILL C” and my knowledge of the IRD market allows me to infer that this is a butterfly swap and its price convention is percent per million.
The CFI Code of KRXXXX just tells me that this is a Rates Strategy.
At least if I want to see if this instrument is still available for trading on 26 March 2018, I can just look for the same identifier on that date and find it. Simple.
Lets move on from table 2, trust me it gets more interesting.
Table 3
Table 3 is an intra-day price report, with specific requirements to publish prices within trade size ranges at the reference times of 9:30, 11:30, 13:30 and 15:30 UTC.

Lets pick a specific day, 19 March 2018 and a specific ISIN, in this case for EUR IRS 10Y and see what the data tells us.
- There was no trade executed in the 2 minute window after 9:30 UTC.
- The first trade executed after this window in size range 1, a notional less than or equal to standard market size, was at a price of 1.0175 at 9:51:40 UTC and it was 25 million notional, the mode of execution was electronic and the reference price at this time was 1.016.
- The first trade executed after the the window, in size range 3, a notional greater than Large-in-Scale (LIS), was at a price of 1.019 at 9:59:41 and it was 50 million notional and the reference price at this time was 1.0195.
- So a difference of 0.15 bps between the first trade and the second
- Then we see further trade executions at 12:03, 13:44 and 15:40 as the first trades executed after 11:30, 13:30 and 15:30.
An interesting insight into intra-day prices and the file has 5,281 rows, so a lot to look at.
Table 4
Table 4 is an end-of-day price report.
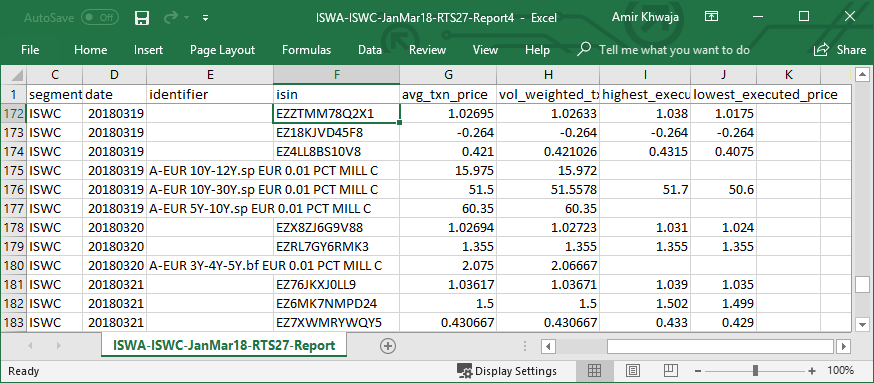
For the same date of 19 March 2018 and the EUR IRS 10Y we looked at in table 3, we see that the average trade price was 1.02695%, the volume weighted average price was 1.02633, highest executed as 1.038 and lowest 1.0175. A high to low range of 2.05 bps and meaning the first execution was saw in table 3 at 9:51 was the low for the day.
Table 5
Table 5 is a cost report and the majority of rows in the csv file simply refer to the venue rate card published on the website, so I won’t re-produce an extract of this below.
The only numeric value I see is for “Total value of all costs (as a % of total traded value during the reporting period volume)”, which for ISWC is given as 0.0011173%, while for ISWR it is given as 0.0005616%.
I take this to mean that the RFQ venue either has greater economies of scale than the CLOB, as more transactions to spread the costs over or it has lower operating cost.
Table 6
Table 6 is a likelihood of execution report, which sounds very interesting, so lets view an extract of that for ISWC.
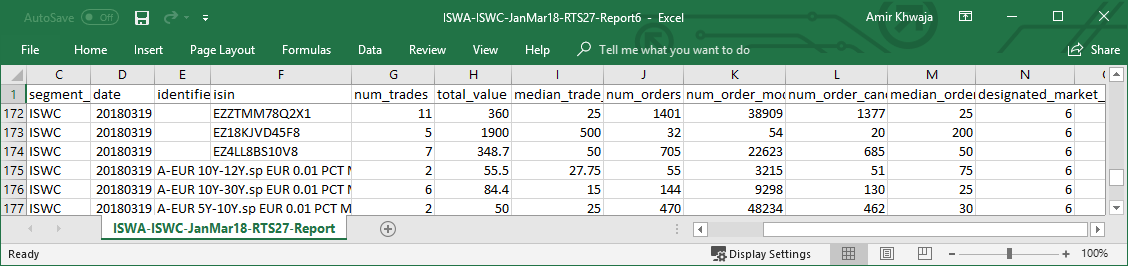
Again looking at our EUR IRS 10Y on 19 March 2018, we see:
- Number of trades was 11
- Total value of 360 million
- Median trade size of 25 million
- Number of orders = 1,401
- Number of orders modified = 38,909
- Number of orders cancelled = 1,377
- Median order size = 25 million
- Designated market makers = 6
I am sure there are interesting ratios to calculate here, but what is even more interesting is to compare this with ISWR, the RFQ venue for the same day and instrument, which shows
- Number of trades was 3
- Total value of 100 million
- Median trade size of 25 million
- Number of orders = 365
- Number of orders modified = 53,490
- Number of orders cancelled = 346
- Median order size = 25 million
Good to see that the CLOB did more trades than RFQ on this day for EUR 10Y IRS and that the median order size is the same. The trade executions to order ratio is similar for both at 0.82% and 0.79%.
Onward.
Table 7 & 8
Tables 7 & 8 provide additional information for Continuous and Order book venues and these are some of the most detailed tables so far, as for ISWC table 7 has 41,904 rows and table 8 has 22,151!
Table 7 has best bid, offer, sizes and order book depth.
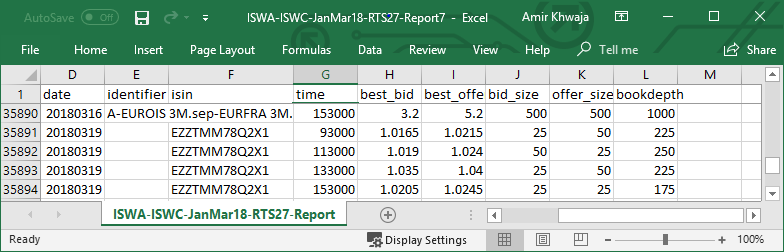
Showing that on 19 March 2018 for EUR IRS 10Y,
- at 9:30 UTC that best bid was 1.0165% in 25 million, while the best offer was 1.0215% in 50 million size and the book depth was 225 million. So a 0.50 bps bid-offer range.
- at 11:30 UTC, the best bid as 1.019 in 50 million, best offer 1.024 in 25 million with a 250 million depth.
Table 8, I won’t reproduce an extract below but for the our selected data and instrument it shows:
- Average volume at best bid offer = 24.7461
- Average spread at best bid offer = 0.004425 (44.25 bps)
- Average book depth for 3 price increments = 212 million
- Number of cancellations at best bid and offer = 579
- Number of modifcations at best bid and offer = 4,154
- Average speed of execution for passive orders = 36.4234 (is this ms?)
Not sure what to make if all this, but it certainly requires thought, analysis and comparison with other venues.
On to the last table.
Table 9
Table 9 is Additional Information for RFQ venues, which purports to provide the mean and median times between acceptance of a quote and execution as well as between a request for quote and provision of any corresponding quotes.
Luckily for you and me, the 469 rows in this file for ISWR show zeros against each date and instrument, so either they got bored producing or measuring these or are so blinding fast that the numbers are all sub 1 millisecond (?) or ESMA not having specified the unit of time in the RTS article itself but have specified it in some Q&A that I am not going to look for, or the assumption is that it says to use ISIN, sorry just kidding I meant minutes. Your guess is as good as mine.
The End
That is it for today.
There are many other Trading venues to look at.
Not to mention the even larger numbers of Systemic Internalisers.
Certainly no shortage of data.
But that is a task for another day.