Back in August 2017 I wrote that “MIFID II Transparency will leave us in the dark“.
I didn’t realise at the time how right I would be.
As I write this blog as of April 2019, I still feel like transparency is sadly lacking.
Could things change in the future?
Transitional Transparency
Regular readers of the blog may recall that I ran a comprehensive series of blogs on MIFID II transparency, and what it might look like when it went live. These included:
- MIFID II TRANSITIONAL TRANSPARENCY
- MIFID II: WHAT SHOULD TRANSPARENCY LOOK LIKE?
- MIFID II TRANSPARENCY WILL LEAVE US IN THE DARK
These blogs were written in the heady summer days of July and August 2017, and in these blogs I concluded with this little snippet:
The Good News
Over time, as the ESMA data gets better, the official LIS and SSTI thresholds will converge with those calculated here.
The methodology to calculate these thresholds is available, transparent and can be replicated if you have the data.
This means that market participants can follow the public data and imply what the SSTI and LIS thresholds should be per instrument.
This is a good thing. It is such a shame that the transitional levels, which will be in place until April 2019, are so wide of the mark. Particularly when there is perfectly good data available!
MIFID II: WHAT SHOULD TRANSPARENCY LOOK LIKE?
That was written with an expectation that the public data under MIFID II would actually be usable. As we know, it has generally fallen wide of the mark.
So we still wait for usable public data.
Will Anything Change?
Here we are, approaching the recalibration date for the transparency thresholds.
On April 30th 2019, I expect to see the first calculations from ESMA, which will supersede the “Transitional Transparency” thresholds. The new thresholds will come in to effect as of June 2019.
Before that date, let’s therefore recap the current situation. It highlights how poor transparency currently is in European markets.
Current Transparency
If you head over to the ESMA Transparency Calculations website, you can download the spreadsheet with all of the transparency thresholds in it. Here, you will find just FOUR entries for Interest Rate Swaps:
What this means is that ESMA found only four types of interest rate swap that were liquid enough to calibrate their transparency thresholds.
Everything else was deemed illiquid.
I’ve written about how unlikely this is previously, so let’s not dwell too much on it. Let’s instead look at what these limits mean for transparency.
Most IRS trades have no pre-trade transparency
If a swap is deemed illiquid for transparency purposes (i.e. it isn’t one of the four above), then the pre-trade transparency threshold is set at just EUR4 million. These levels for illiquid instruments were set out in the original RTS2 text:
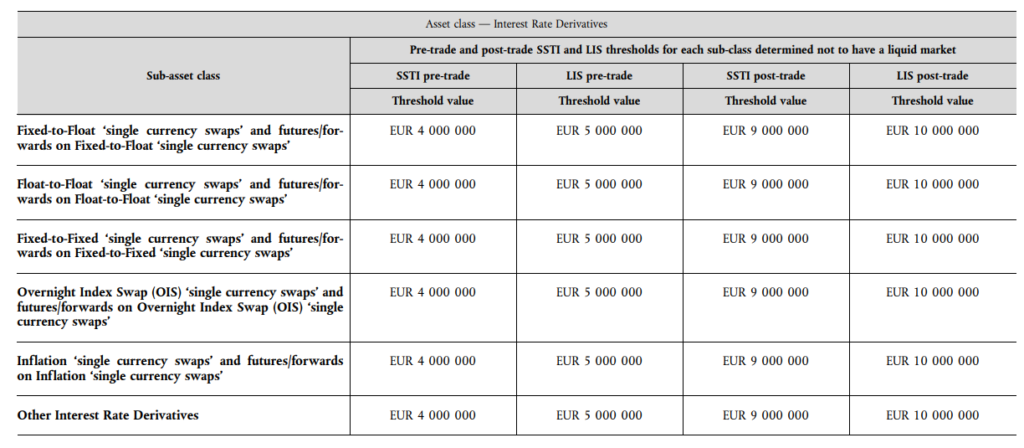
Pre-trade transparency requirements are hence waived if the transaction is above this threshold.
Just how low is this current threshold? Let’s run the data on 10Y USD IRS reported to the US SDRs:
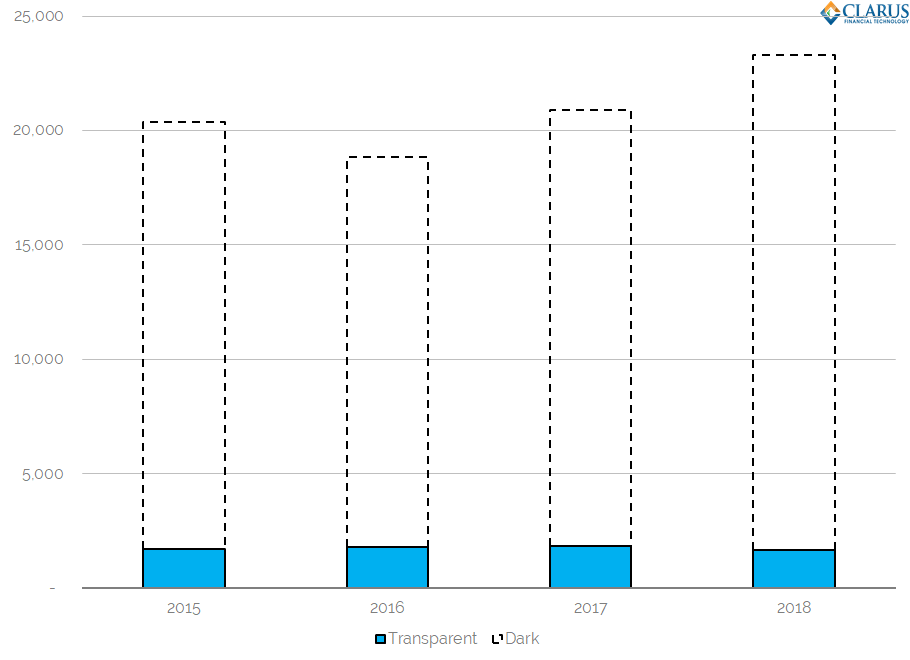
Showing;
- If the MIFID II pre-trade transparency rules applied in the US, we would have had pre-trade transparency for just 8% of the 10 year USD IRS trades reported in the US during 2018 (as measured by trade count).
- This has been pretty stable year-on-year.
- This means a huge 92% of 10y USD IRS trades would have had no pre-trade transparency.
- This shows how incredibly low this threshold is.
However, even if a trade is deemed liquid, this does not ensure pre-trade transparency. This is because the threshold for transparency (“SSTI”) is still set at a very low level of just EUR25m (maturity dependent). Take a look at the 6y USD IRS data below:
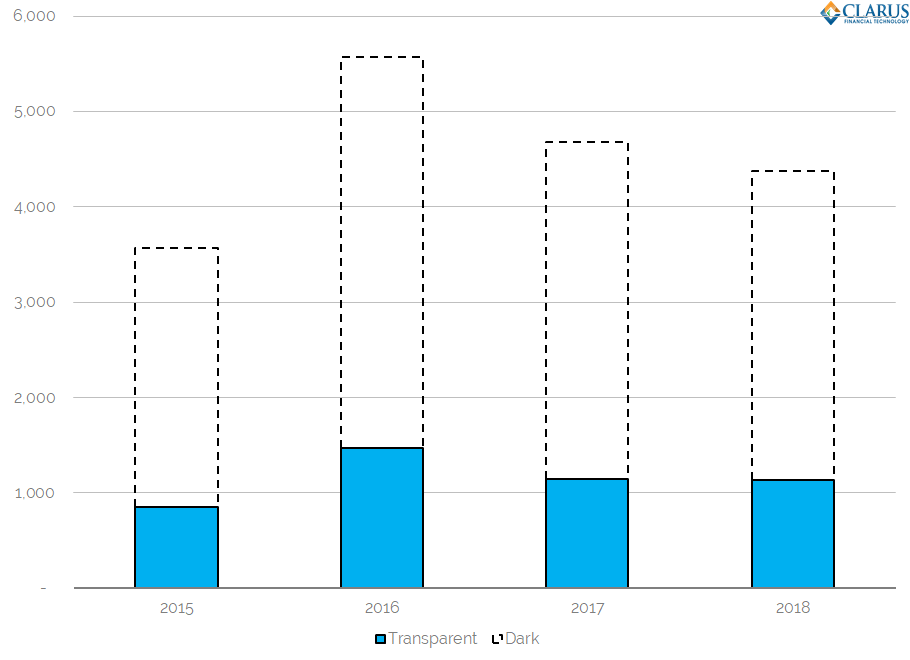
MIFID II pre-trade transparency thresholds applied to 6y USD IRS
Showing;
- Even for a liquid instrument such as 6y USD IRS, pre-trade transparency would only exist for 34% of trades (by trade count).
- This means that even for instruments deemed to be liquid, there is no pre-trade transparency for 66% of a market instrument that is deemed liquid.
- This again shows how incredibly low this threshold is.
Most IRS trades have four week deferred “transparency”
If a swap is deemed either (a) illiquid, or (b) the transaction size is above the SSTI thresholds for post-trade (e.g. is above €55m EUR for a 10y EUR IRS), then a 4 week deferral period applies for the publication of the post-trade “transparency” data.
4 WEEKS!
No matter how shocking I find this length of deferral, I thought I should also highlight how expansive these deferrals are.
We have precious little access to MIFID II transparency data – as I’ve mentioned in the past. However, Bloomberg remain a shining light.
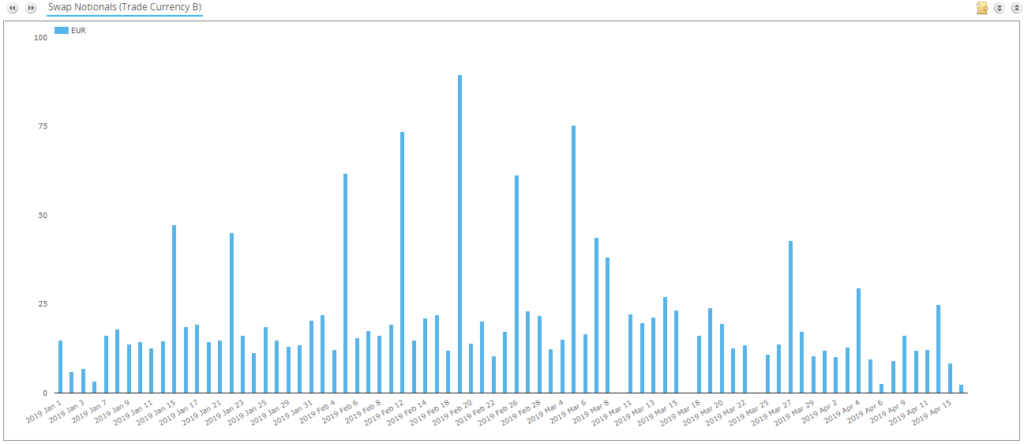
Using RTS2 data from the Bloomberg APA and MTF, we can see just how much volume of EUR IRS traded is benefiting from this 4 week deferral period:
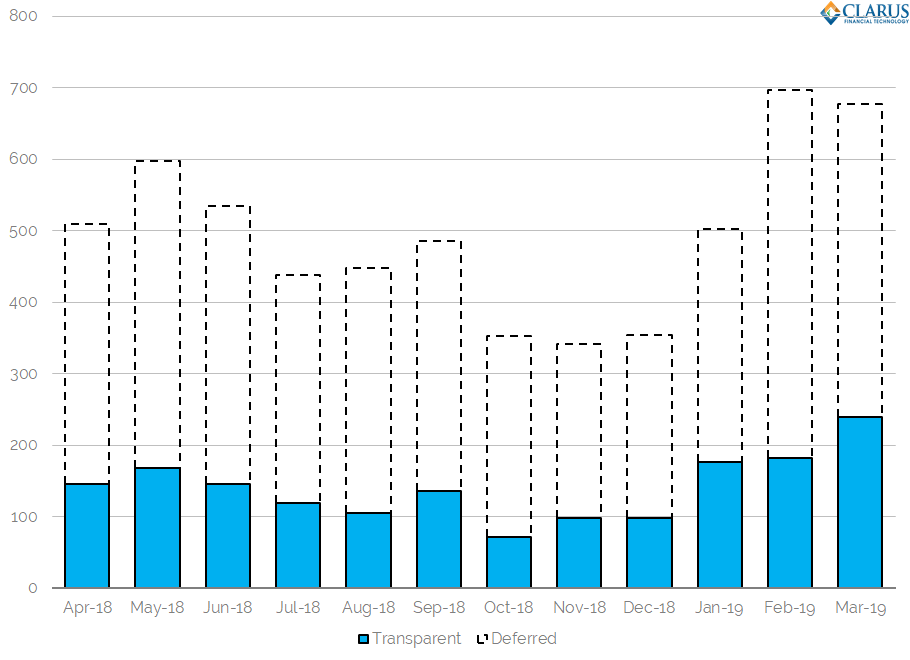
Showing;
- The RTS2 data from Bloomberg (both APA and MTF), shows that 72% of EUR IRS traded (by volume) is reported with a deferral.
- We calculate this figure by looking at the flags applied to the reports. Details of the flags can be found in the RTS2, Table 3 here.
Deferrals are bad for transparency and data quality
I may be stating the blindingly obvious here, but these four week deferrals severely impact the quality of post-trade data. For example, we see regular weekly peaks in the data when batches of transactions are “released” for the previous deferral periods.
I cannot believe that this was an intended behaviour of the design of post-trade data? Having so much of the data deferred results in:
- An inability to see trends in the data.
- Impossible to reconstruct a picture of daily trading activity.
- Distortions in volumes traded depending on whether a “Tuesday” is included or excluded in the time window.
Will our frustrations end on April 30th 2019?
My eyes are peeled for whether the transitional transparency calculations are updated in 13 days time….
As ever, we’ll keep you updated.