Since our First Look at Total Return Swaps blog, we have added a Most Actives view in SBSDRView. This identifies the most active stocks on which TRS are transacted and below I look at what this data shows.
Number of trades
The two main derivative products in SBSDRs for Equities are Total Return Swaps (TRS) and Contract for Differences (CFDs) on single stocks. If we segment the data, we see the following average daily volumes in July 2022 (up to 25th July), for five major currencies:
- USD TRS with 66,000 trades a day and CFD with 27,500
- EUR TRS with 26,000 trades a day and CFD with 7,000
- GBP TRS with 20,000 trades a day and CFD with 4,500
- JPY TRS with 20,000 trades a day and CFD with 6,000
- AUD TRS with 5,500 trades a day and CFD with 2,500
With such large numbers of trades, a query that can aggregate by most active names, provides transparency and can answers questions such as:
- what names are trading,
- in what amount and
- how is this different to prior periods?
That is what the Most Active tab in SBSDRView provides.
(It also filters the data appropriately to address issues with data quality highlighted in our First Look at TRS blog).
USD TRS
Let’s start by looking at USD TRS between July 1, 2022 to July 25, 2022, ranked by gross notional traded.
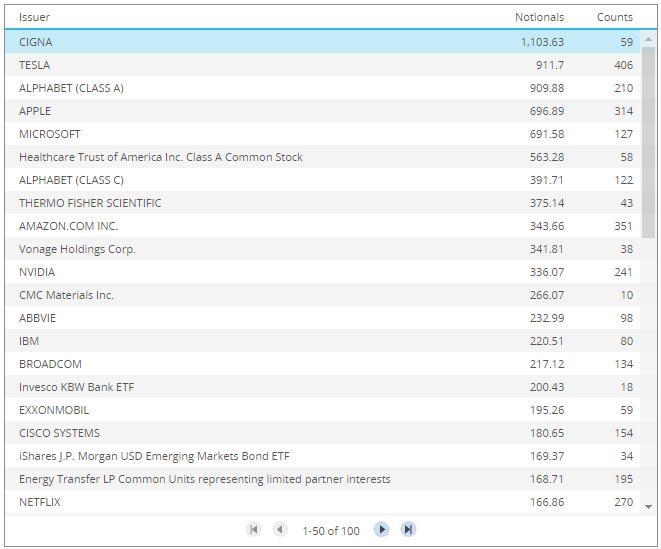
- Showing just the top 20 out of 100 most active US names
- CIGNA with the largest notional of $1.1 billion and 59 trades
- TESLA with $910 million and 406 trades
- ALPHABET (A) with $910 million and 210 trade, while (C) has $390m and 122 trades
- ….
- NETFLIX with $166 million and 270 trades
Drilling down on CIGNA, we find 5 large trades; 3 of which are disclosed at the capped notional of $250 million, the other 2 at $210 million and $130 million, all transacted on July 6, 7 and 12. The remaining trades are all less than $1 million, except for a single $5 million trade.
Let’s now look at last week’s most active names and highlight a few differences.
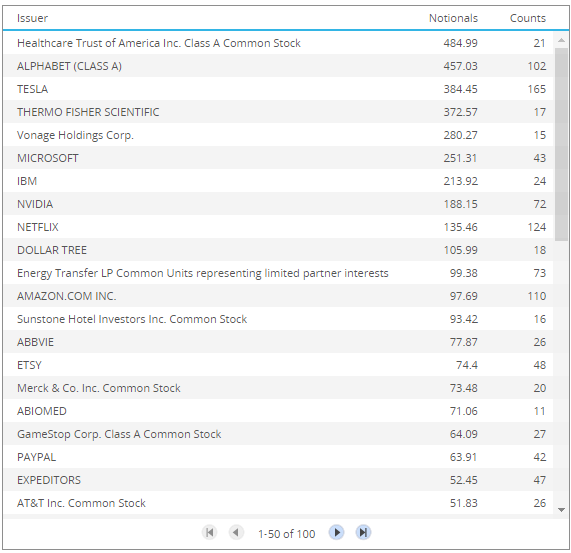
- CIGNA falling out of this list and not in the top 100.
- Healthcare Trust now top with $485 million from 21 trades
- NETFLIX much higher in 10th spot (quarterly results were last week)
- Dollar Tree in the list
- …
- Gamestop in 18th spot with $64million and 27 trades (the reddit stocks still going strong?)
And next let’s look at yesterday.
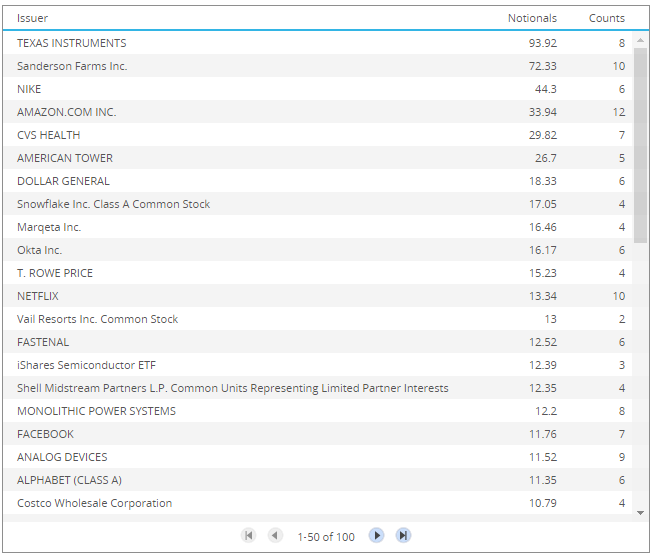
A very different list, with Texas Instruments, Sanderson Farms and Nike the top three.
Using the API
To automate the above queries for any period, we can use the SBSDRView API.
The following code in python, will return the same set of results as above.
import clarus
response = clarus.sbsdr.mostactive(assetClass='EQ',productType='TRS')
print (response)
Easy to use and allowing the creation of your own dashboards or reports.
USD CFD
Next USD CFDs between July 1, 2022 to July 25, 2022, ranked by gross notional traded.
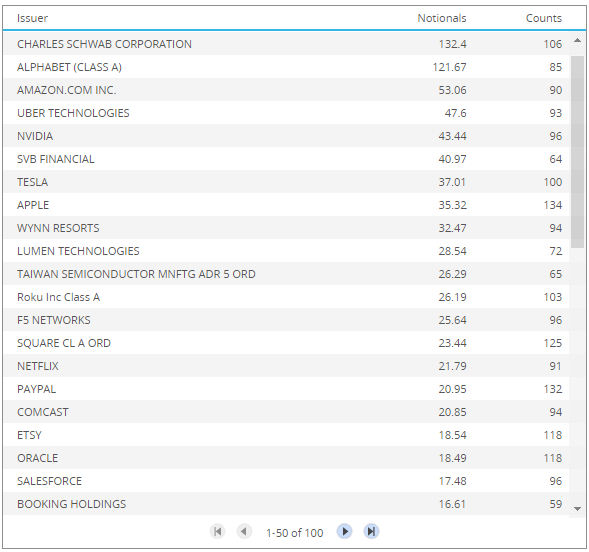
- Smaller gross notionals in CFDs than TRS
- Only 2 names with >$100m notional and even in the top 20, notionals of <$20m
- Trade counts comparable to TRS
- So much smaller average trade sizes, which makes sense for a retail product like CFDs
Let’s now look at the other four major currencies.
EUR TRS
EUR TRS between July 1, 2022 to July 25, 2022, ranked by gross notional traded.
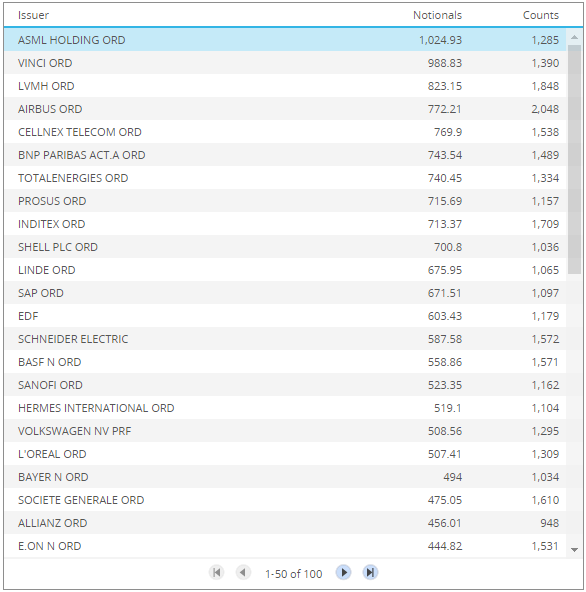
- Showing just the top 20 out of 100 most active names
- ASML the largest notional of $1 billion and 1,285 trades
- VINCI with $988 million and 1,390 trades
- LVMH with $823 million and 1,848 trades
- ….
So while gross notionals in EUR are similar to USD, the trade counts are much higher, meaning smaller average deal sizes.
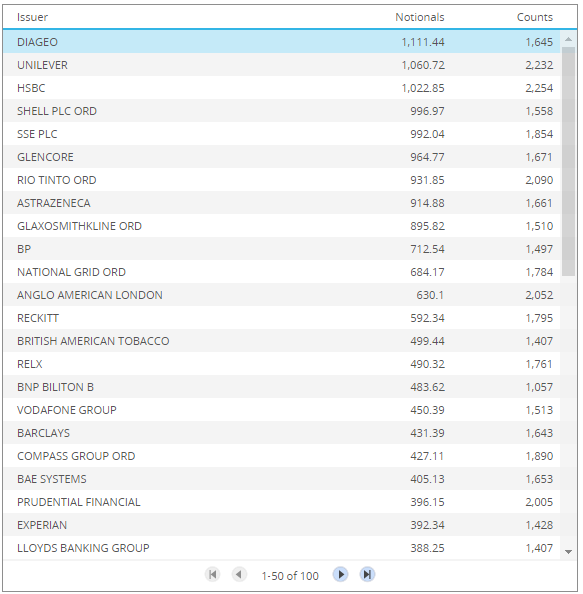
GBP TRS
GBP TRS for the same period, is similar to EUR in gross notional and trade counts.
JPY TRS
JPY TRS between July 1, 2022 to July 25, 2022, ranked by gross notional traded.
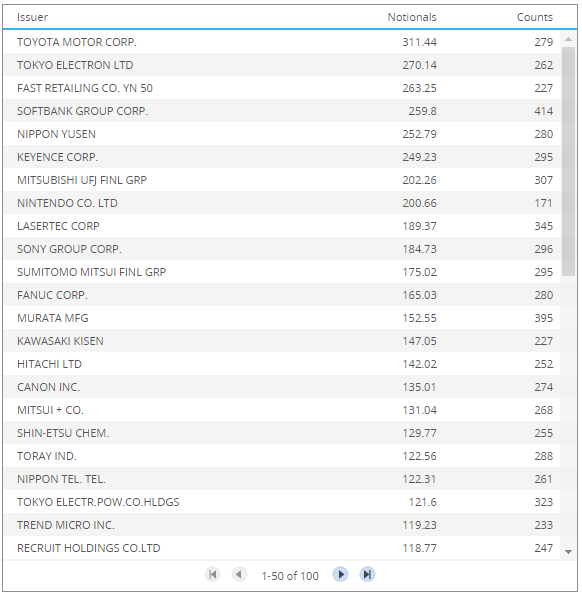
Toyota Motor with > $300 million from 279 trades.
Generally smaller gross notionals than in USD, but similar trade counts.
AUD TRS
AUD TRS between July 1, 2022 to July 25, 2022, ranked by gross notional traded.
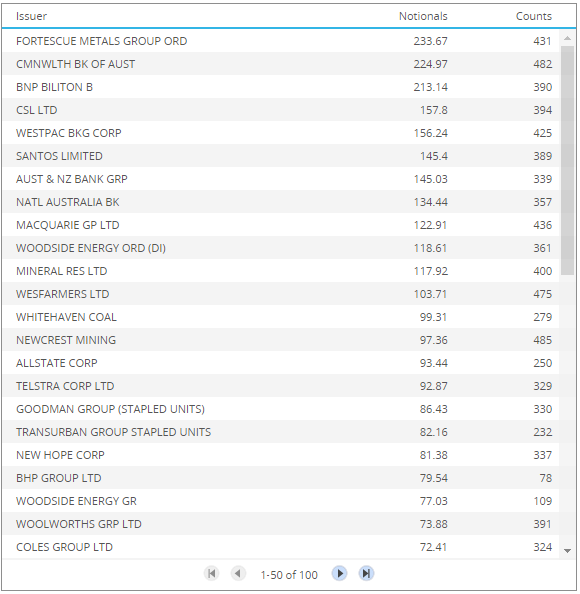
Fortesque, CBA and BHP Biliton, the only names with > $200 million.
That’s all for today.