- Cleared volumes are now a significant portion of the NDF market.
- The percentage of the NDF market that is cleared has steadily increased every month since September, to now stand at 14%.
- We estimate that 35% of Dealer-to-Dealer volumes are now cleared as a consequence of the Uncleared Margin Rules.
A Brief Recap
Our SDRView data products display trades reported by US Persons to trade repositories and is available close-to-real-time. From previous estimates, we know that the portion of the NDF market that this covers is around 38%, providing a guide to overall market activity.
The exact proportion of the NDF market covered by SDRView is derived from April 2016 BIS data. In our subsequent analysis, we use this percentage as a scaling factor to estimate overall NDF market activity during subsequent months:
Showing;
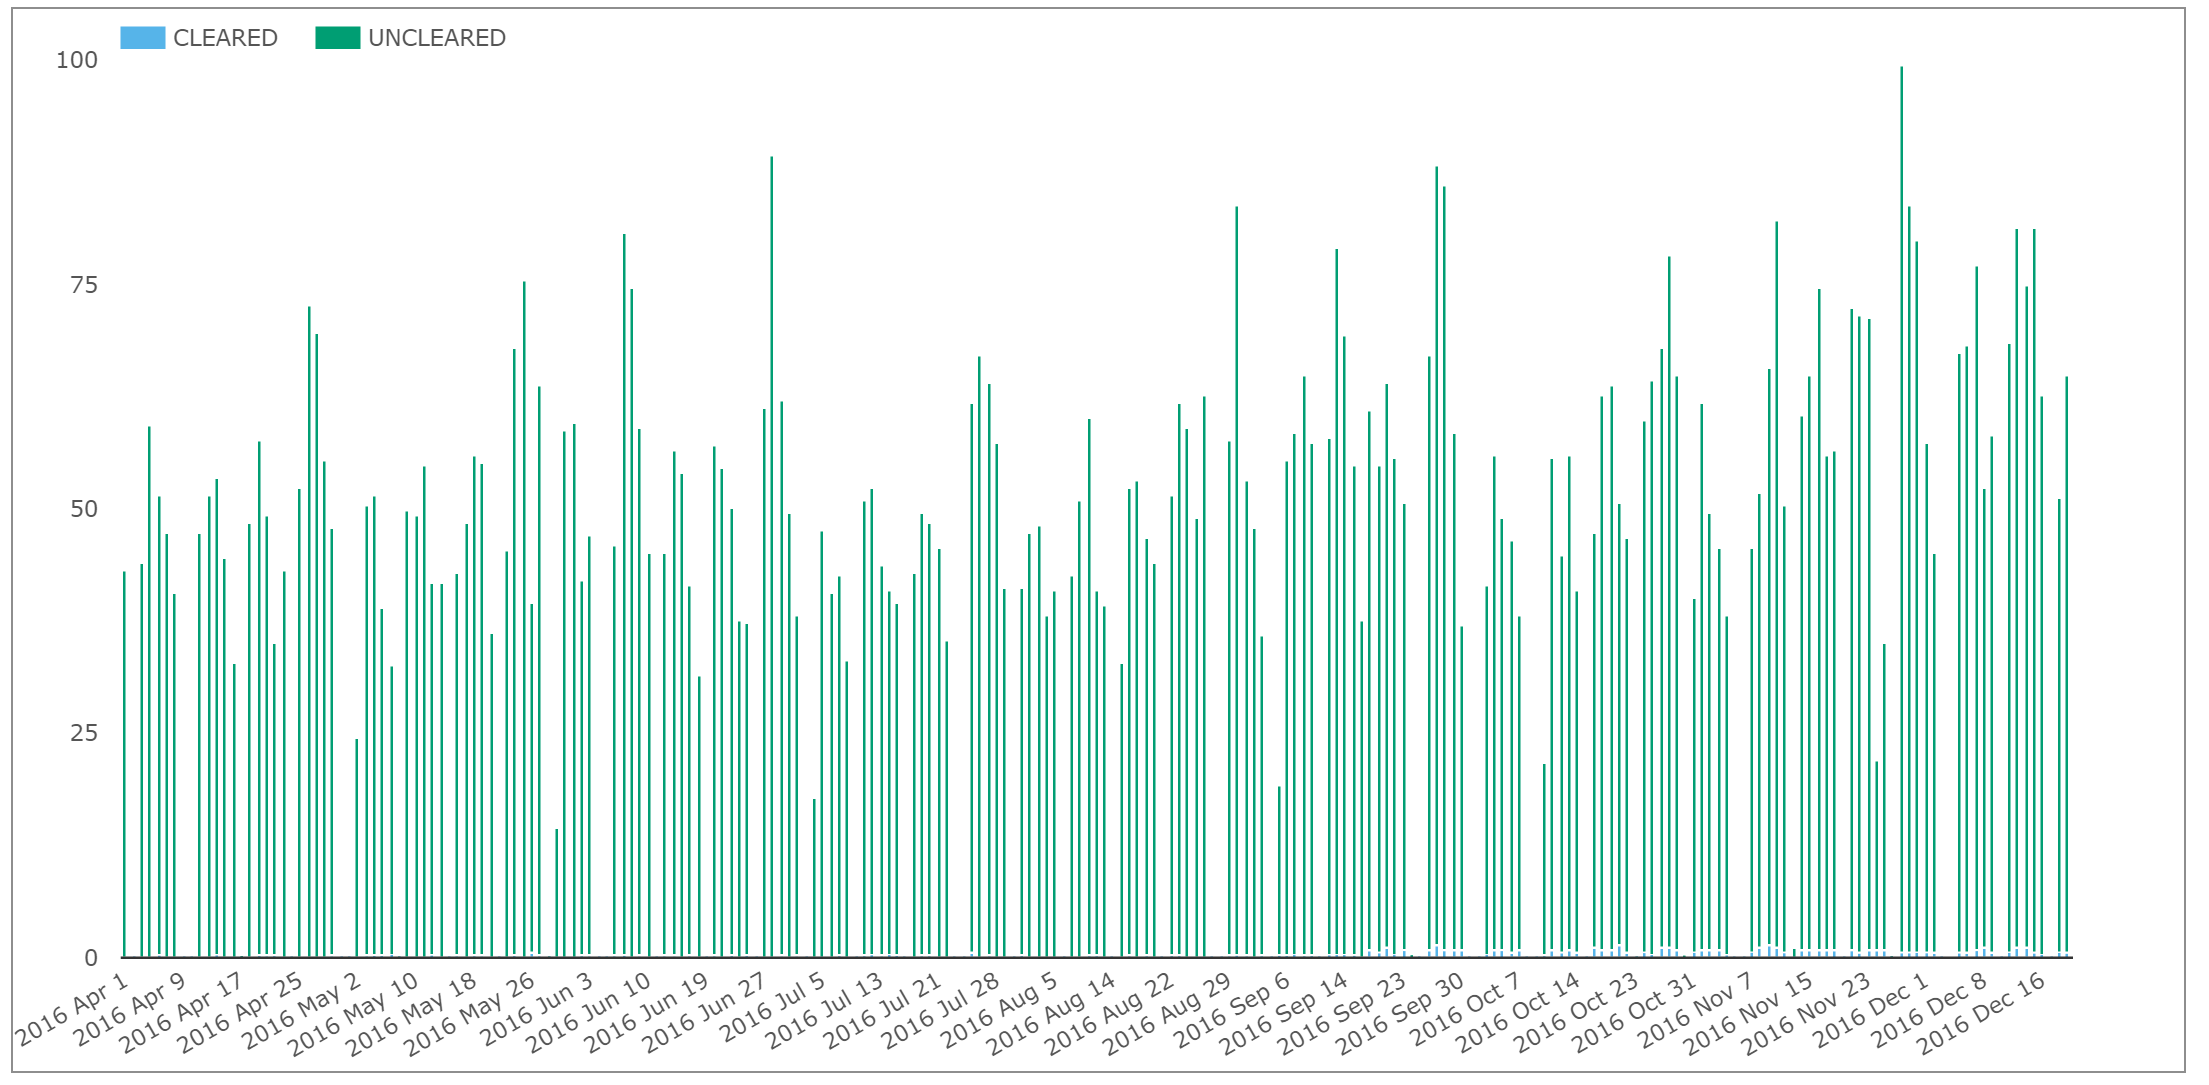
- Daily volumes of NDFs reported to SDRs since April 2016.
- This includes both trades reported as Uncleared and Cleared.
- Using this data, we can see that SDR data yields an Average Daily Volume of $49.9bn during April 2016.
- BIS data reports an NDF ADV versus USD of $130.2bn.
- This suggests that SDRView data covers 38% of the market.
We will therefore assume that SDRView consistently accounts for 38% of the overall market in our subsequent analysis.
Analysing NDF markets via Clarus data
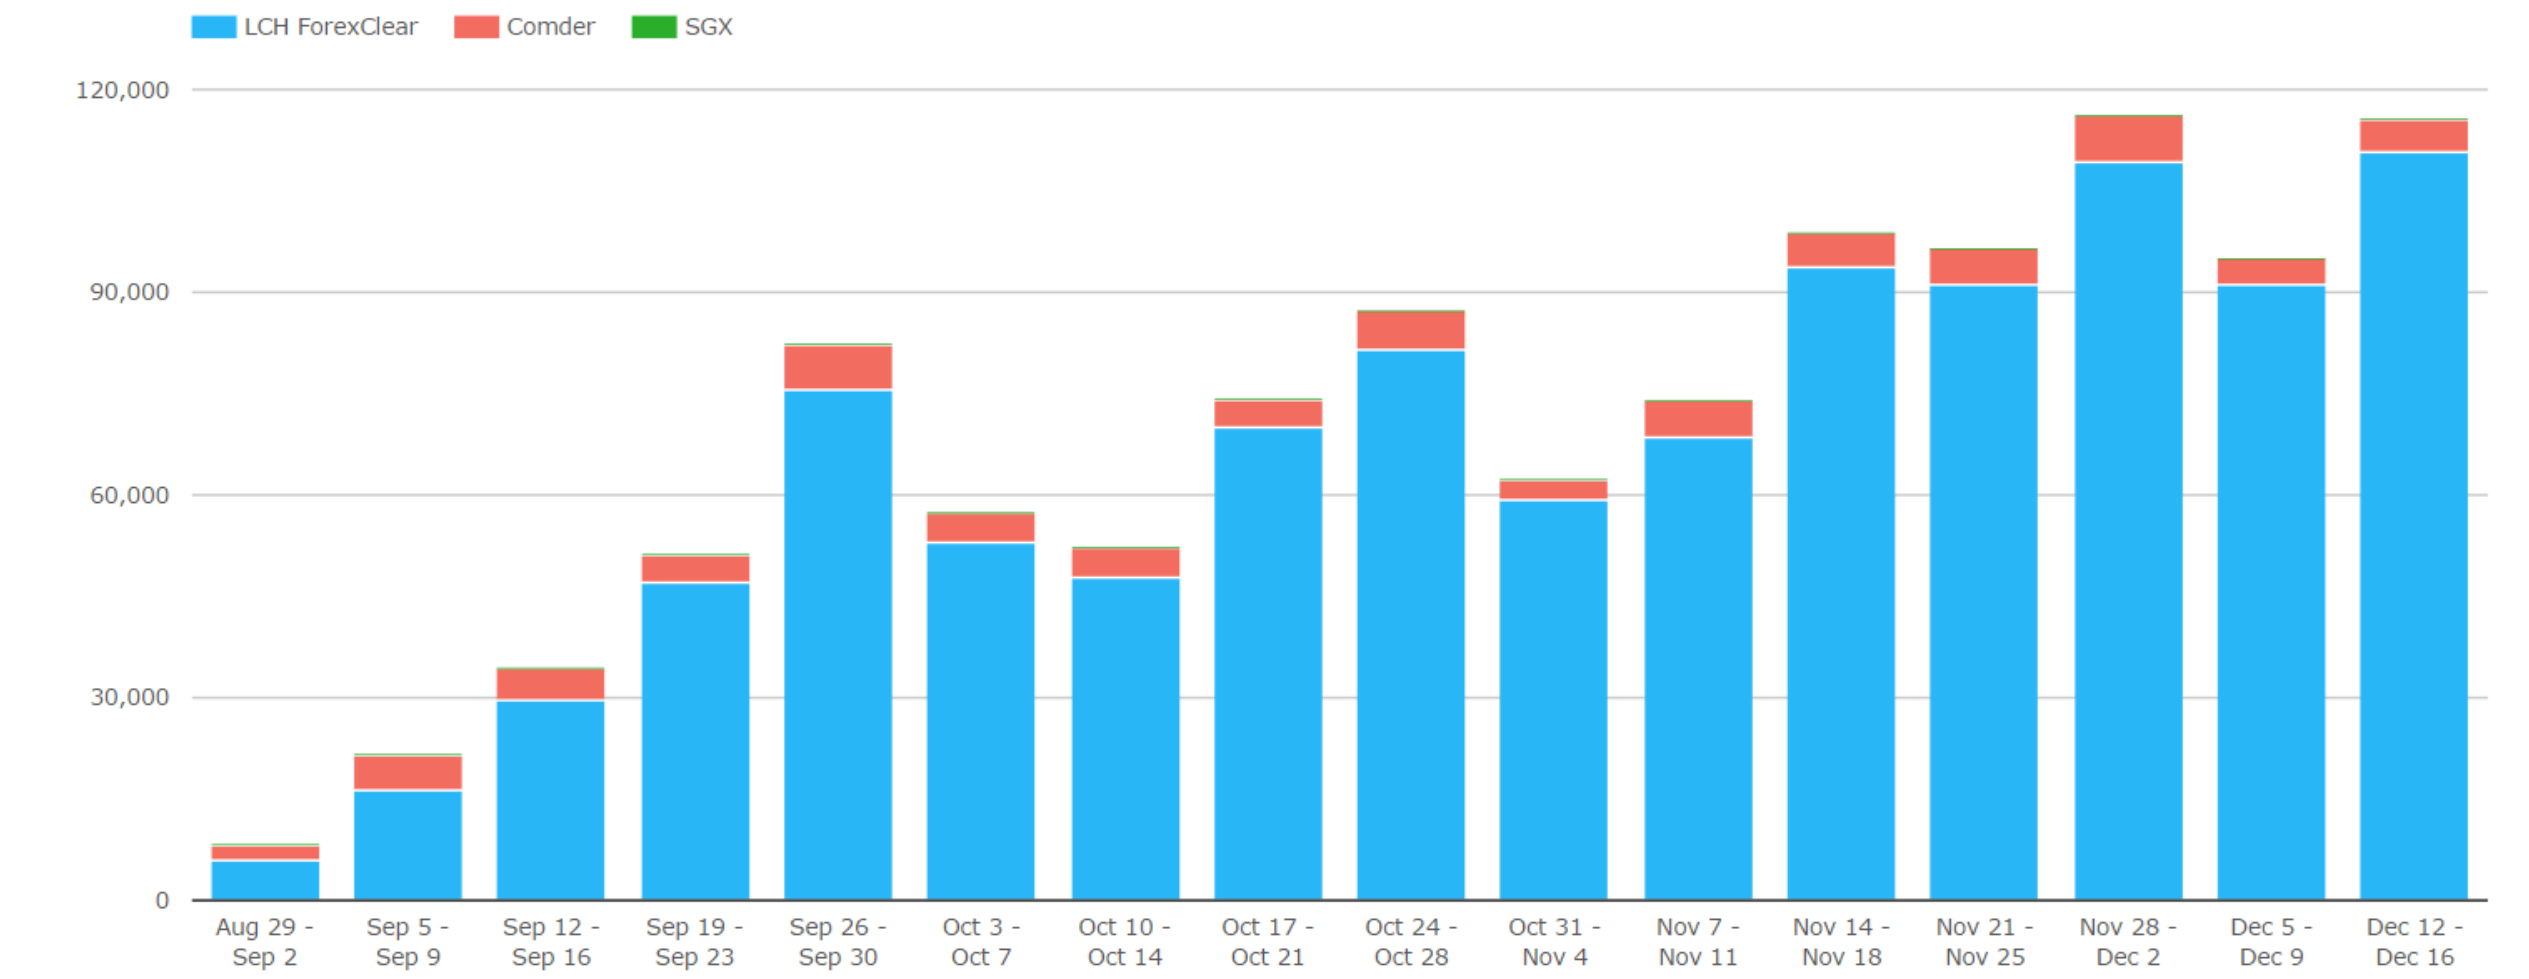
CCPView provides global coverage of cleared OTC derivatives. The chart below shows weekly cleared volumes of NDFs since the first week of September. Almost every week since the introduction of the Uncleared Margin Rules has resulted in record volumes of NDFs being cleared:
Showing;
- In the first week of September, about $8bn was cleared. $6bn was at LCH ForexClear.
- Last week, $115bn cleared! Nearly $111bn of this was at LCH.
- Much of the growth has hence occurred at LCH, who now enjoy a 95% market share.
We know from monitoring volumes in IRS that December in particular has been a high volume month so far – as was November. So it is useful to put this growth in NDF volumes in perspective. Are we seeing generally higher volumes or is more of the market being cleared this month than last?
We therefore combine this cleared data with the SDRView data and the scalar from above (i.e. 38%). This allows us to estimate what percentage of the whole market is being cleared across time:
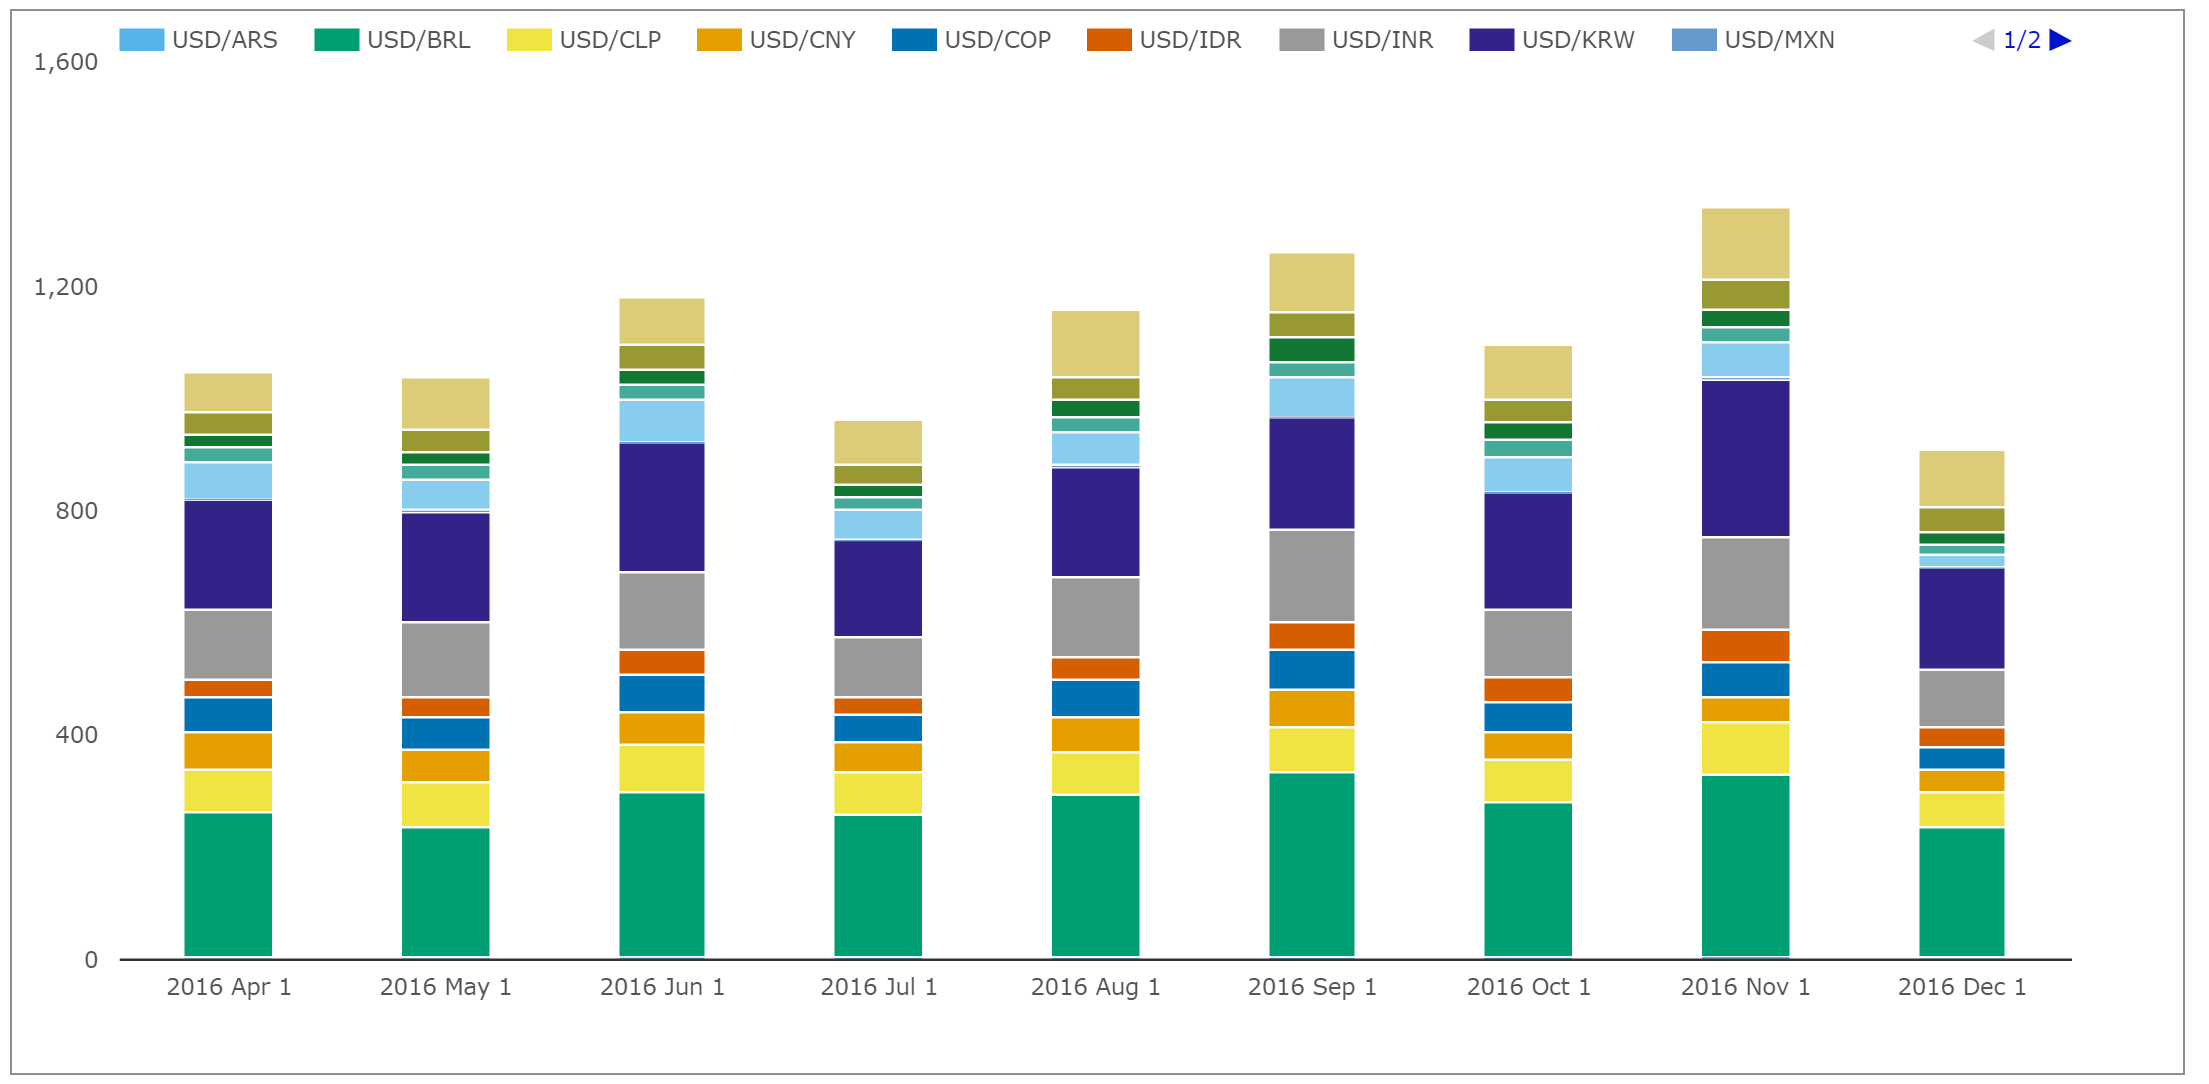
- SDRView NDF Volumes (both Cleared and Uncleared) in April 2016 were $1,048bn, equating to an ADV of $49.9bn.
- SDRView NDF Volumes in November 2016 were $1,339bn, equating to an ADV of $60.9bn.
- SDRView NDF Volumes in December 2016 so far were $794bn, equating to an ADV of $66.2bn.
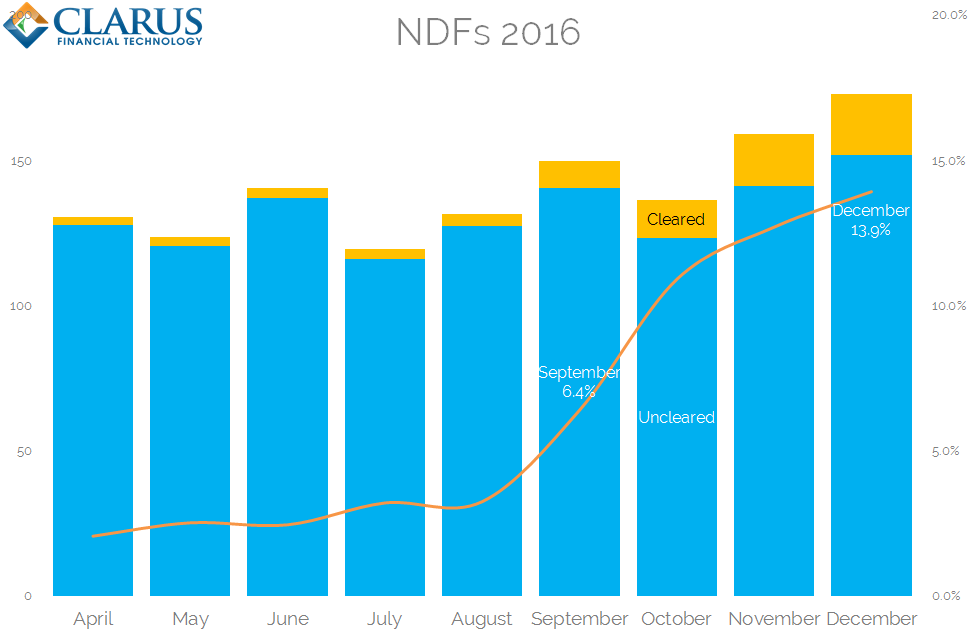
During each month, we assume that SDRView consistently reports 38% of the market. We therefore see the following evolution of Clearing in NDFs during 2016:
Showing;
- 2.1% of the entire NDF market was cleared in April 2016, consistent with our earlier data.
- This first increased in July and August to 3.2%.
- And doubled in September to 6.4%.
- Updating our previous analysis for October shows that nearly 11% was cleared that month.
- With nearly 13% being cleared in November.
- The growth of clearing has continued this month as well.
- Nearly 14% of the market has been cleared in December 2016 so far.
Our data sources therefore show not only that NDF volumes have been increasing recently, but that clearing has consistently grown at a faster rate, becoming an ever more significant portion of volumes since the UMRs were introduced.
D2D Market
SEFView provides venue-by-venue volume data for derivatives traded across SEFs. From our deep-dive into the USDBRL market, we also know that clearing is particularly prevalent in the D2D space. Therefore, let’s also use SEFView to compare volumes on D2D venues with what is currently being cleared:
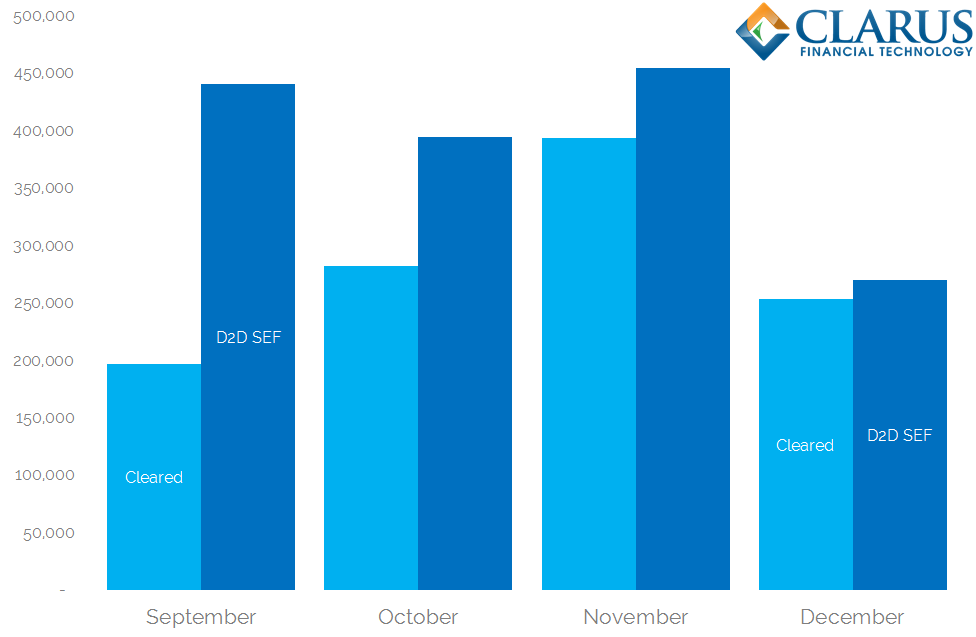
Showing;
- Monthly volumes across all NDF currency pairs that are cleared (light blue bars), and NDFs traded on D2D SEF venues (dark blue).
- The SEF trading volumes represent the D2D US Persons market. We can assume that SEFView shows a similar portion of the market as SDRView at around 38%.
- It is interesting to note the comparison between the volumes. Cleared volumes have constantly grown relative to D2D volumes.
- This implies that more and more of the Dealer to Dealer market is being cleared.
- Overall, the data implies that about 35% of D2D volumes globally are now being cleared.
In Summary
- Clarus data provides trade-by-trade and venue specific volume information for nearly 40% of the global NDF market.
- This data gives us timely insights into market trends, such as the uptake of clearing as a result of the Uncleared Margin Rules.
- Clearing now accounts for around 14% of volumes across the whole market.
- When we look at only the D2D NDF market, 35% of volumes are now cleared.
- The uptake of clearing has happened rapidly. Clarus data has allowed our clients to stay on top of these important market infrastructure changes.