So that our readers don’t have to go through the pain, I’ve read the most recent ESMA Regulatory Technical Standards (RTS) on NDF markets. In summary, ESMA would like the market’s view on mandatory clearing for NDFs vs USD in the following 11 currencies:
- BRL
- CLP
- CNY
- COP
- IDR
- INR
- KRW
- MYR
- PHP
- RUB
- TWD
NDFs have been a part of the Clarus product suite for the whole of 2014. To help examine the background to the ESMA proposal, we can therefore analyse a whole heap of data from the DTCC.
Trade Sizes
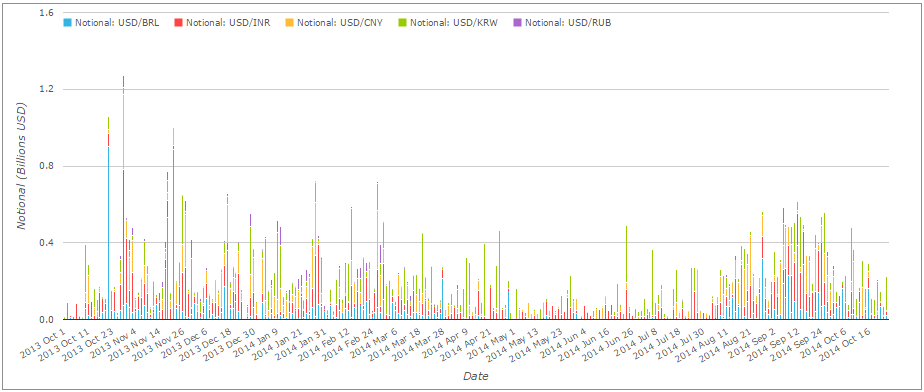
Using the History app in SDRView, the most striking aspect is the sheer variation in sizes traded on any given day in the NDF markets. You can only really get a sense of any kind of trend by inserting a 10 day (or longer) moving average onto the total notional traded per day.
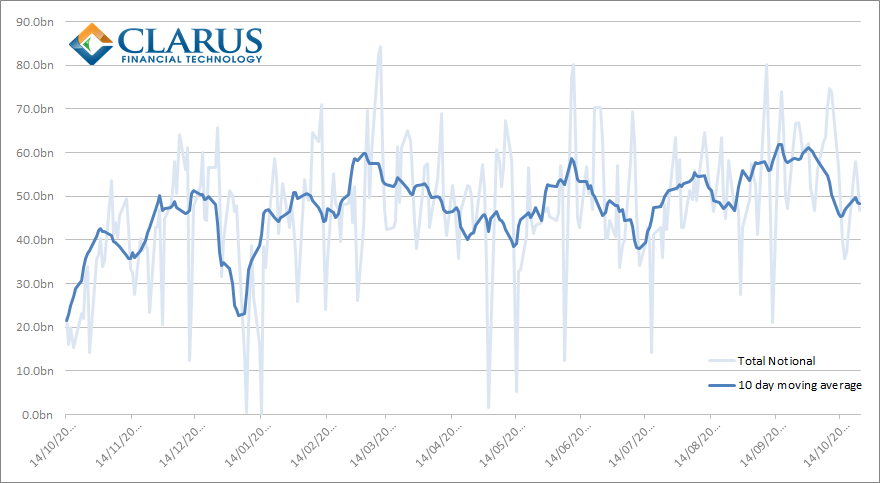
From which we can see that:
- On a peak trading day, over $80bn per day can trade.
- Volumes (or reported volumes!) were generally on an upward trend until the beginning of October this year.
- The relative standard deviation (standard deviation as a percentage of the mean) is very high at 31%. This highlights the large variability in the amounts traded per day.
- Average Daily Volume (ADV) has been $47bn for the period October 2013-2014. This is consistent with the past 10 trading days as well, with an ADV of $48.3bn.
Currencies
We have focused on the 11 currencies outlined by ESMA; as Amir highlighted at the beginning of the year, these are the main currency pairs we see coming through anyway. For October 2014 MTD, we see the following overall currency split by notional:
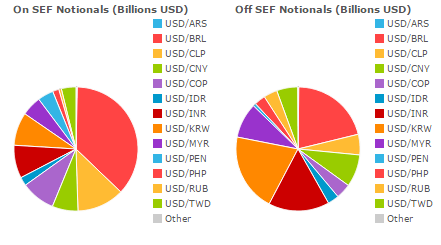
Looking at the raw data and running the numbers for the whole year, of the 11 ESMA currency pairings, we see that USD/BRL is the most traded, taking around 27% of the ADV. As ESMA rightly point out in their paper (paragraph 62), this is largely down to the reporting bias towards American counterparties that is captured in the DTCC source data.
Average Trade Sizes
Another interesting aspect of the data is the difference in average trade sizes between markets. Whilst USD/BRL is the largest market by volume, it is actually USD/CNY that has the largest average trade size – at almost $16m:
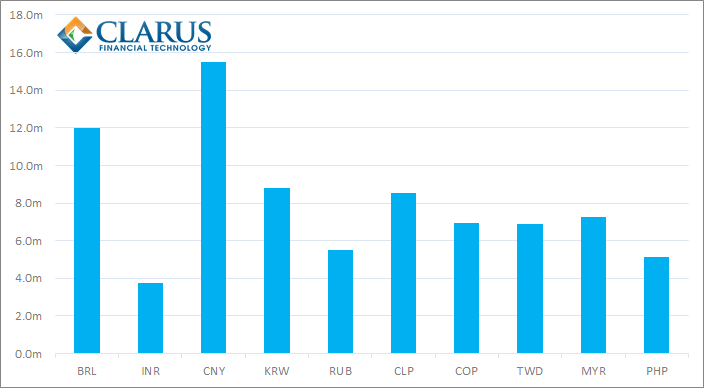
If we had comparable granularity for European trade reporting, it would be fascinating to see whether average trade sizes are comparable between timezones.
Maturities
Equally important for the regulators are the range of maturities being traded. Here, we can clearly see that the market is focused almost exclusively on the short-end:
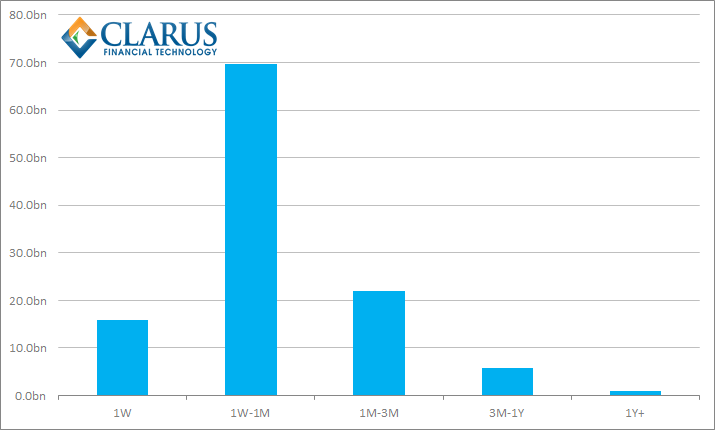
The chart above shows total notionals traded for the week ending October 24th across the five most-traded currency pairs – BRL, CNY, INR, KRW, RUB. Nearly 61% of all transactions are in maturities over 1 week and up to one month. Not even 1% of transactions have a maturity greater than 1 year.
Execution
It is also important to understand how these trades are transacted. Given that we haven’t even seen a clearing mandate for NDFs yet, an execution mandate remains way off. However, SEFs have been quick to offer these products as they are well suited to their workflows. As such, SEFs see quite a few transactions. For example, during the last week 65% of NDFs traded off-SEF versus a fairly impressive 35% on-SEF.
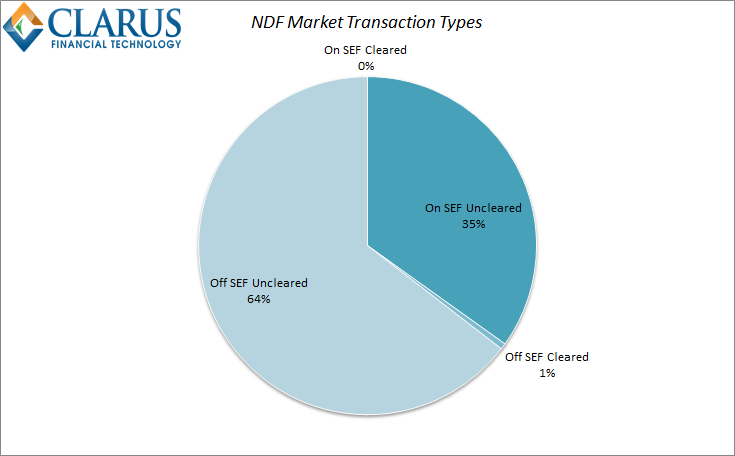
Clearing
The chart above also shows the paucity of trades that are currently cleared. The whole point of the ESMA RTS is to assess the suitability of the NDF market for a clearing mandate. To date, the market has shown very little inclination to clear the vast majority of trades. Remember that across all NDFs, ADV can be as high as $80bn, and we typically see $47bn trading across the 11 ESMA currencies. In light of which, the following chart is somewhat underwhelming:
Across BRL, CNY, INR, KRW and RUB, the above chart shows:
- A peak cleared daily volume of just $1.27bn.
- The average cleared volume has been small at $216.5m.
- Collating all of our data, we can see that only 0.68% of the volume traded in the sample period October 2013- October 2014 was cleared.
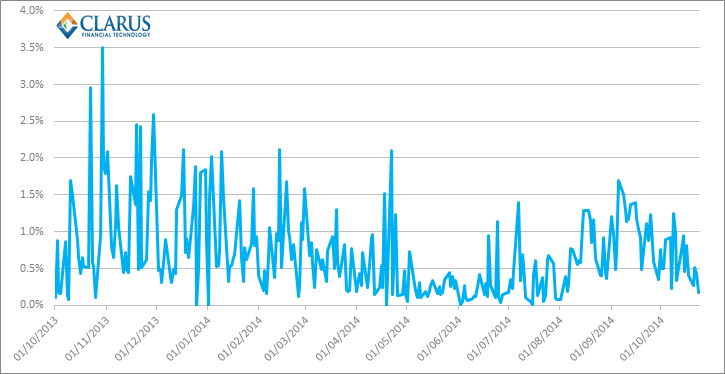
In addition, there does not seem to be a lot of momentum towards clearing. If we look at the percentage of the market cleared on any given day during the year, the trend is not a positive one at the moment:
Summary
The NDF market is characterised by fairly small, short maturity trades. Given this small risk footprint, market participants are currently unwilling to embrace clearing, particularly given settlement risk is already minimised through the very nature of the product. This is probably best highlighted by ESMA itself in paragraph 100 of the RTS which states
“LCH.Clearnet Ltd currently has 20 clearing members for NDF…..of which 2 are offering client clearing.”
It will be interesting to see the responses from the market over the coming days to the ESMA RTS. The infrastructure is already there for clearing. Despite economic advantages under Basel III/CRD IV guidelines, the market has been slow to embrace the clearing opportunity. Will market participants vociferously defend their current position and seek to avoid clearing NDFs?