Continuing with our monthly review series, let’s take a look at Interest Rate Swap volumes in October 2016.
First the highlights:
- On SEF USD IRS volume in October at >$1.6 trillion was 12% lower than September
- SEF Compression activity was $200 billion in USD IRS, same as prior month
- USD OIS volume at >$1.76 trillion was down from >$2.4 trillion
- But USD OIS again exceeded USD IRS for the third month in a row
- On SEF EUR, GBP, JPY IRS volumes were up 23%
- At $270 billion, they were 26% of USD IRS, much higher than the 18% YTD
- SEF Market Share shows Tradeweb just above Bloomberg
- CME–LCH Switch volumes at $47 billion are up signficicantly
- CME–LCH Basis Spread is also up
- Global Cleared Volumes were down
- LCH SwapClear down 20%, CME down 23%, JSCC down 27%
- In Asia volumes were similar to prior month
- In LatAM volumes were up, with CME up 17%
Onto the charts, data and details.
USD IRS ON/OFF SEF
Using SDRView the gross-notional volume of On and Off SEF USD IRS Fixed vs Float price forming trades (Outrights, SpreadOvers, Curve/Flys).
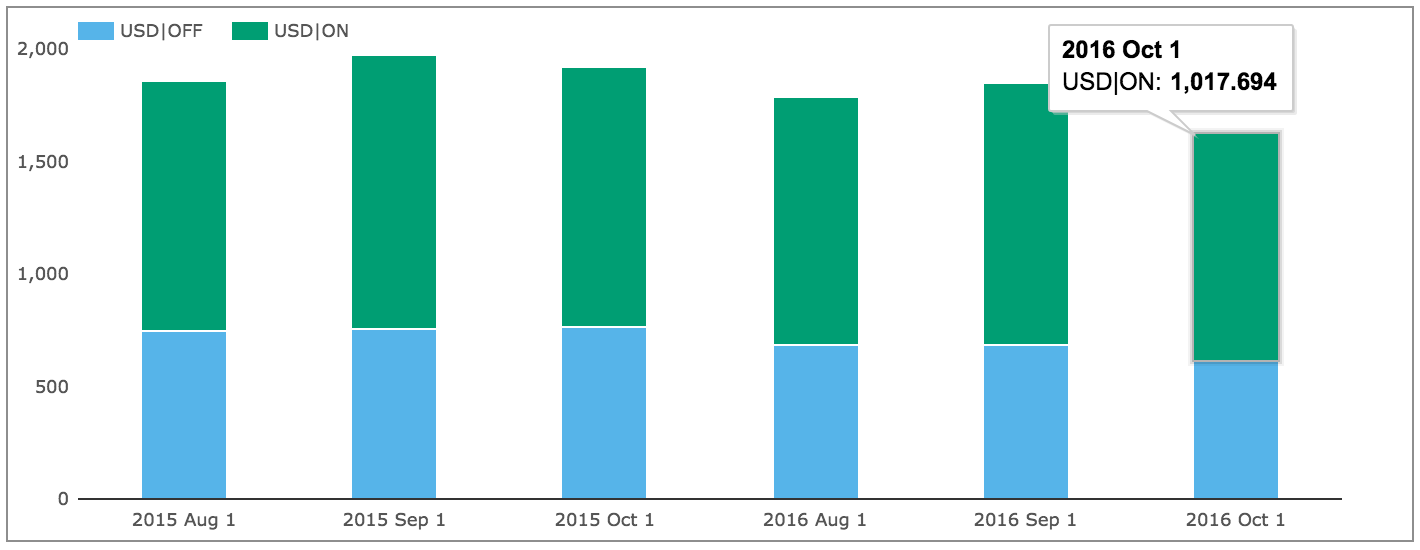
Showing:
- October 2016 On SEF gross notional is > $1,018 billion
- (recall capped trade rules mean this is understated as the full size of block trades is not disclosed)
- 12% lower than September 2016 and 12% lower than October 2015
- September 2016 Off SEF gross notional is > $610 billion
- 11% lower than September 2016 and 20% lower than October 2015
- And On SEF vs Off SEF is 63% to 37%, similar to the YTD average
And splitting by package type and showing On SEF DV01 (adjusted for curves and flys).
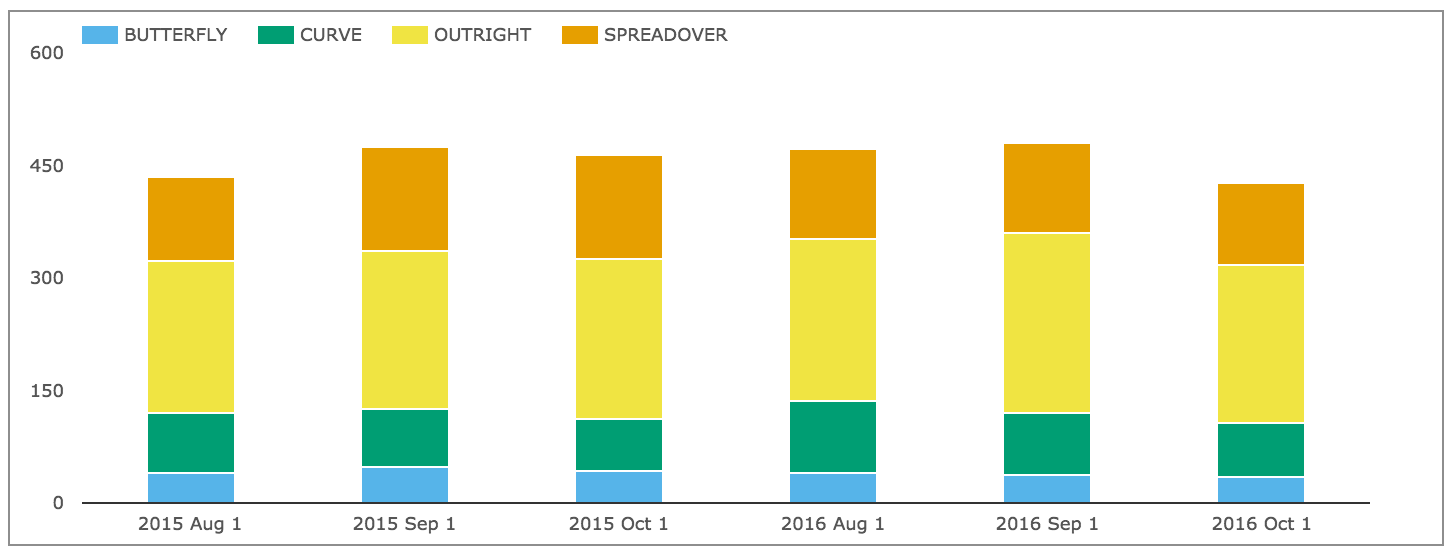
Showing:
- In DV01 terms October 2016 was 11% lower than September 2016
- Overall >$427 million of DV01 was traded in the month
- (recall capped trade rules mean this is understated)
- Compared to October 2015, DV01 was 8% lower
- All packages types were lower than September 2016, by similar percentages
And gross notional of On SEF non-price forming trades; Compression and Rolls.
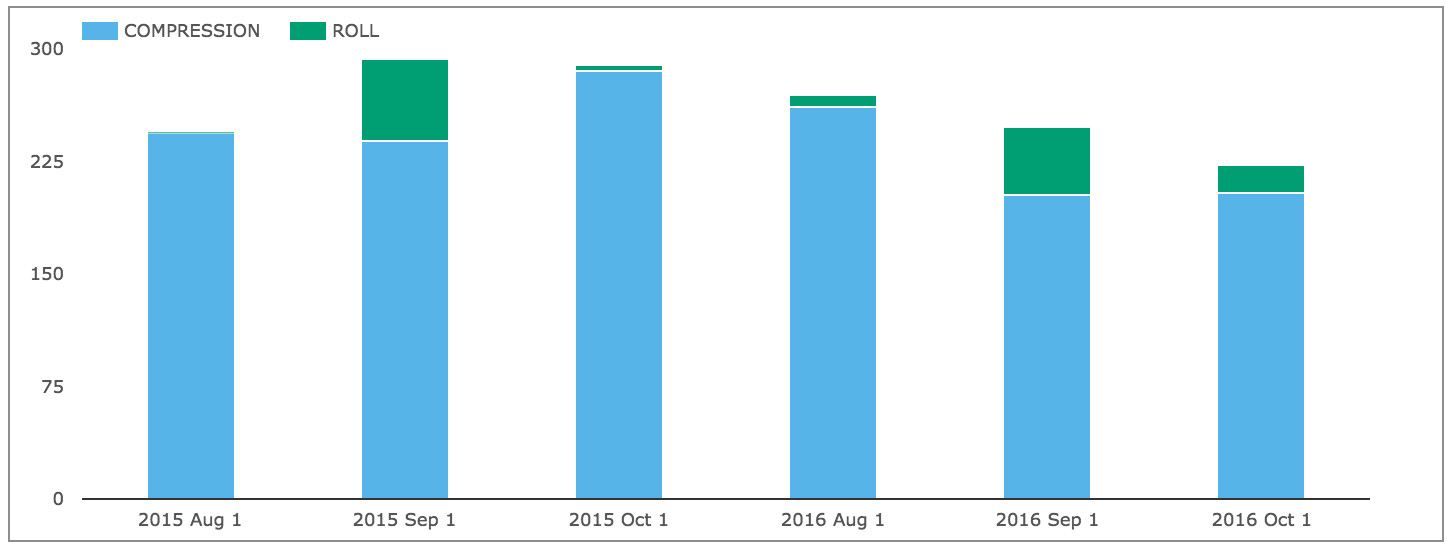
Showing:
- Compression in October 2016 was >$204 billion
- The same as September 2016
- And down 28% from October 2015
- October 2016 Rolls were >$18 billion
- Surprisingly high for a non-IMM month
- September 2016 Rolls were $46 billion
USD OIS Swaps
Lets check and see how volumes in USD OIS Swaps have performed.
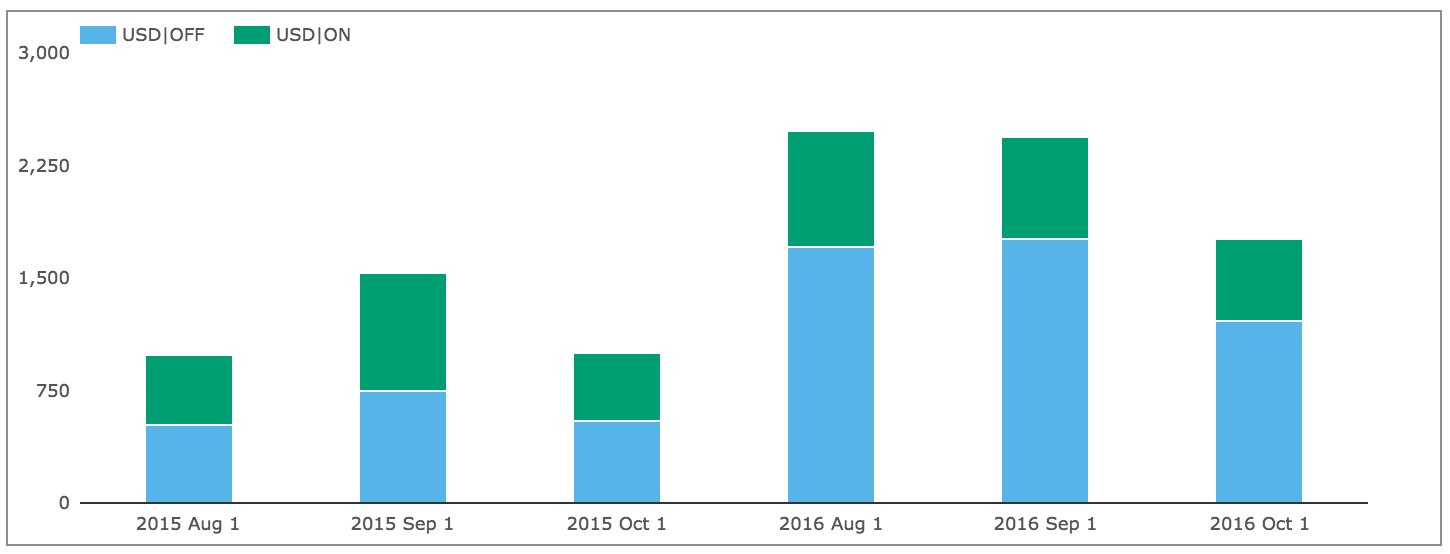
Showing:
- October volumes are much lower than September 2016
- October Off SEF gross notional is > $1,216 billion, down from > $1,764 billion in September 2016
- October On SEF gross notional is > $547 billion down from > $676 billion in September 2016
- (recall capped trade rules mean this is understated as the full size of block trades is not disclosed)
- The combined total is > $1.76 trillion
- Just higher than the > $1.6 trillion of USD IRS in October 2016
- The third second consecutive month that we see USD OIS higher than USD IRS
- Though OIS trade counts of 1,307 in October 2016 are 5% of the 27,321 in USD IRS
USD IRS Prices
Lets now take a look at what happened to USD Swap rates in the month.
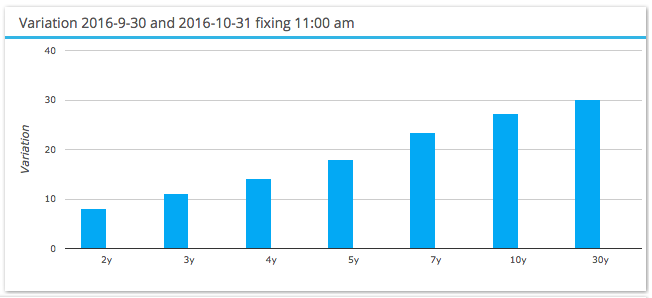
Showing:
- A steepening across the board
- 5Y up 18 bps and 30Y up 30 bps
10Y Swap rates ended the month at 1.69%, up from the 1.42% at end September.
EUR, GBP, JPY Swaps
Next On SEF volumes of IRS in the other three major currencies.
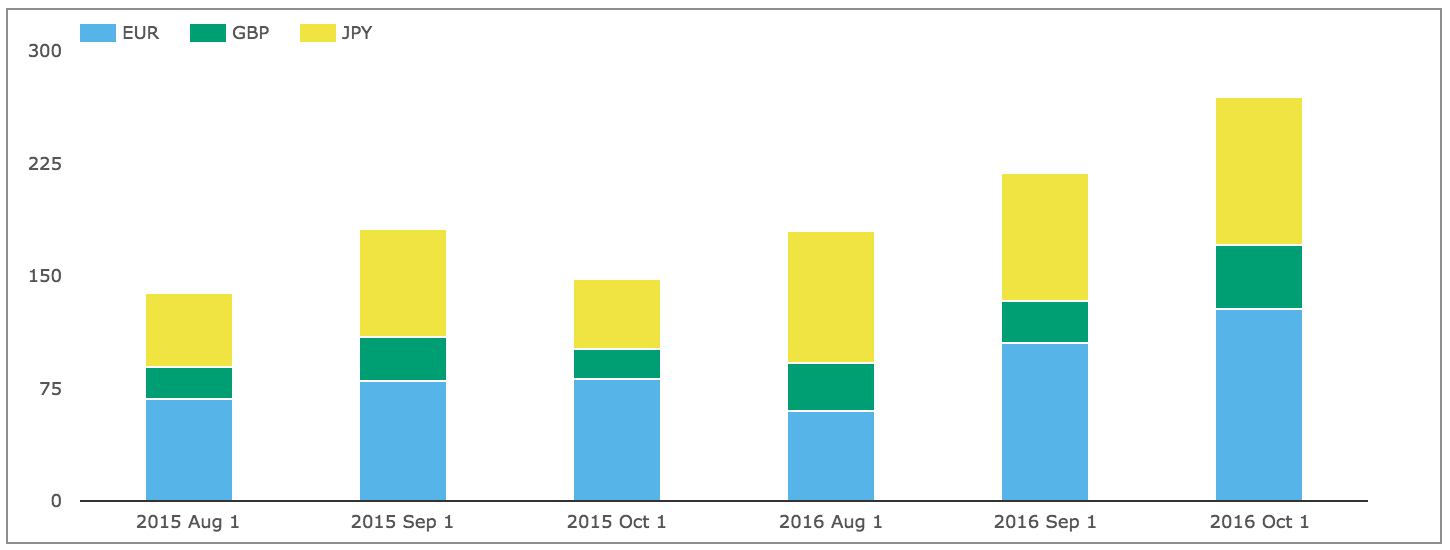
Showing:
- Volumes in October are up 23% from September 2016
- GBP is up to $43b from $27b, up 58%
- EUR is up to $128b from $106b, up 21%
The overall gross notional in these currencies of >$269 billion is 26% of the USD IRS ON SEF volume, much higher than the 18% YTD average.
And then SEF Compression activity.

Showing that October is much lower than the prior two months, but still massively higher than 2015. Overall volume of $63 billion in October is 31% of the $204 billion of USD IRS.
EONIA and SONIA
Again similar to USD, lets check how volumes in EONIA & SONIA have performed.
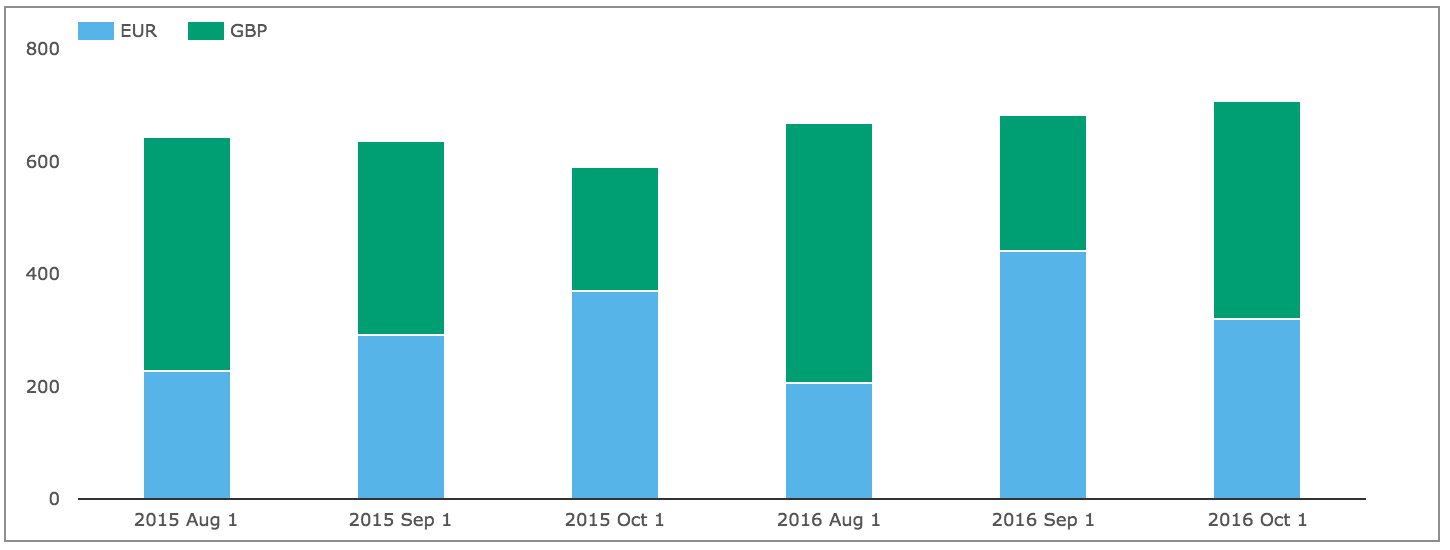
Showing that overall volumes in October at >$708 billion is higher than prior months.
Compared to the $1.76 trillion of USD OIS, the $708 billion of EONIA and SONIA in October, is 40%, much higher than the 28% in September 2016.
SEF Market Share
Lets now turn to SEFView and SEF Market Share in IRS including Vanilla, Basis and OIS Swaps.
DV01 (in USD millions) by month for USD, EUR, GBP and by each SEF, including SEF Compression trades and use a chart to compare the relative share in October 2016 with the prior three months.
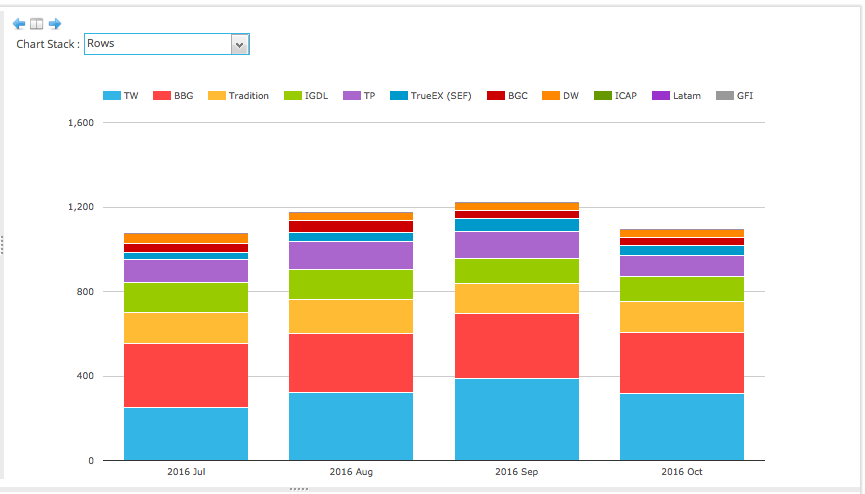
Showing that:
- October volume at $1.1 billion is lower than the $1.2 billion in September
- Tradeweb remains on top, just above Bloomberg
- Tradition, ICAP, Tullet next, in that order
- TrueEX similar to prior months
- BGC just above Dealerweb
In gross notional terms $1.5 trillion of USD IRS traded On SEF in October.
From SDRView data above, we know that $1.02 trillion of price forming capped gross notional and $222 billion of capped compression and roll volumes was reported, making the understatement $258 billion, or put another way the SDR total figure of $1.24 trillion understates by 21% the actual notional.
CCP Basis Spreads and Volumes
In SEFView we can isolate CME Cleared Swap volume at the major D2D SEFs (on the assumption that this is all CME–LCH Switch trade activity). Lets look at this for the past 4 months.
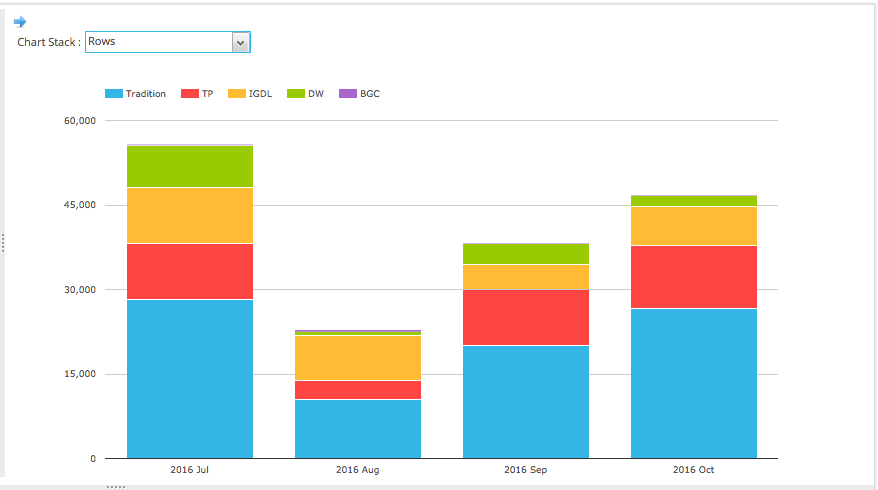
Showing:
- Overall volume in October was $47 billion, up again from prior month
- Tradition maintains a healthy lead with 57% share in gross notional terms
- Tullet with 24%, ICAP 15% and DW 4% in the month
CME-LCH Basis Spreads are up again (same as prior month), with 10Y at 3.00 bps up from 2.75 bps and 30Y at 4.15 bps up from 3.90 bps.
Global Cleared Volumes
Now onto CCPView to look at Global Cleared Swap Volumes for EUR, GBP, JPY & USD Swaps.
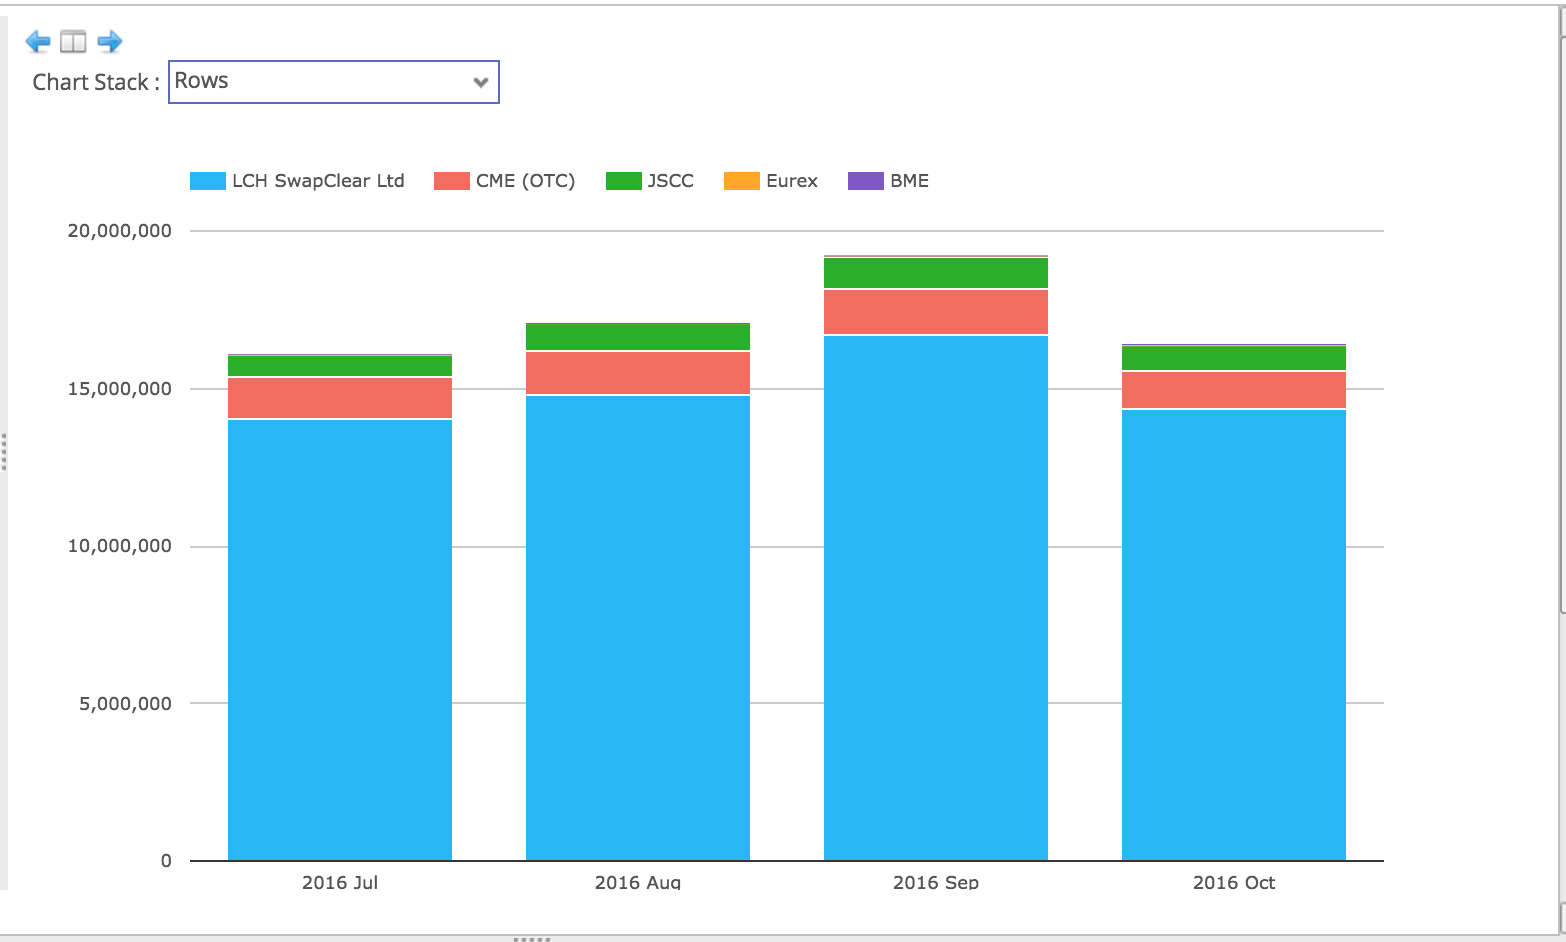
Showing:
- Overall Global Cleared Volumes is down this month (consistent with SEF data)
- LCH SwapClear volume at $13.4 trillion, is down 20% from September
- CME volume at $1.16 trillion, is down 23%
- JSCC volume at $740 billion, is down 27%
- Eurex with $21 billion, is down from the $34b in September
- BME figures are not yet available
Asia and LatAm
Before we end lets look at some charts for Asian and LatAm currencies.
First the volume of AUD, HKD, SGD Swaps (including Vanilla, OIS, Basis, Zero Coupon).

Showing:
- LCH SwapClear up to $1.22 trillion from the $1.12 trillion in September
- ASX at $124 billion, down from $169 billion
- CME at $2 billion, down from $20 billion
- SGX at $8.3 billion, down from from $6.8 billion
Second the volume of MXN and BRL Swaps.
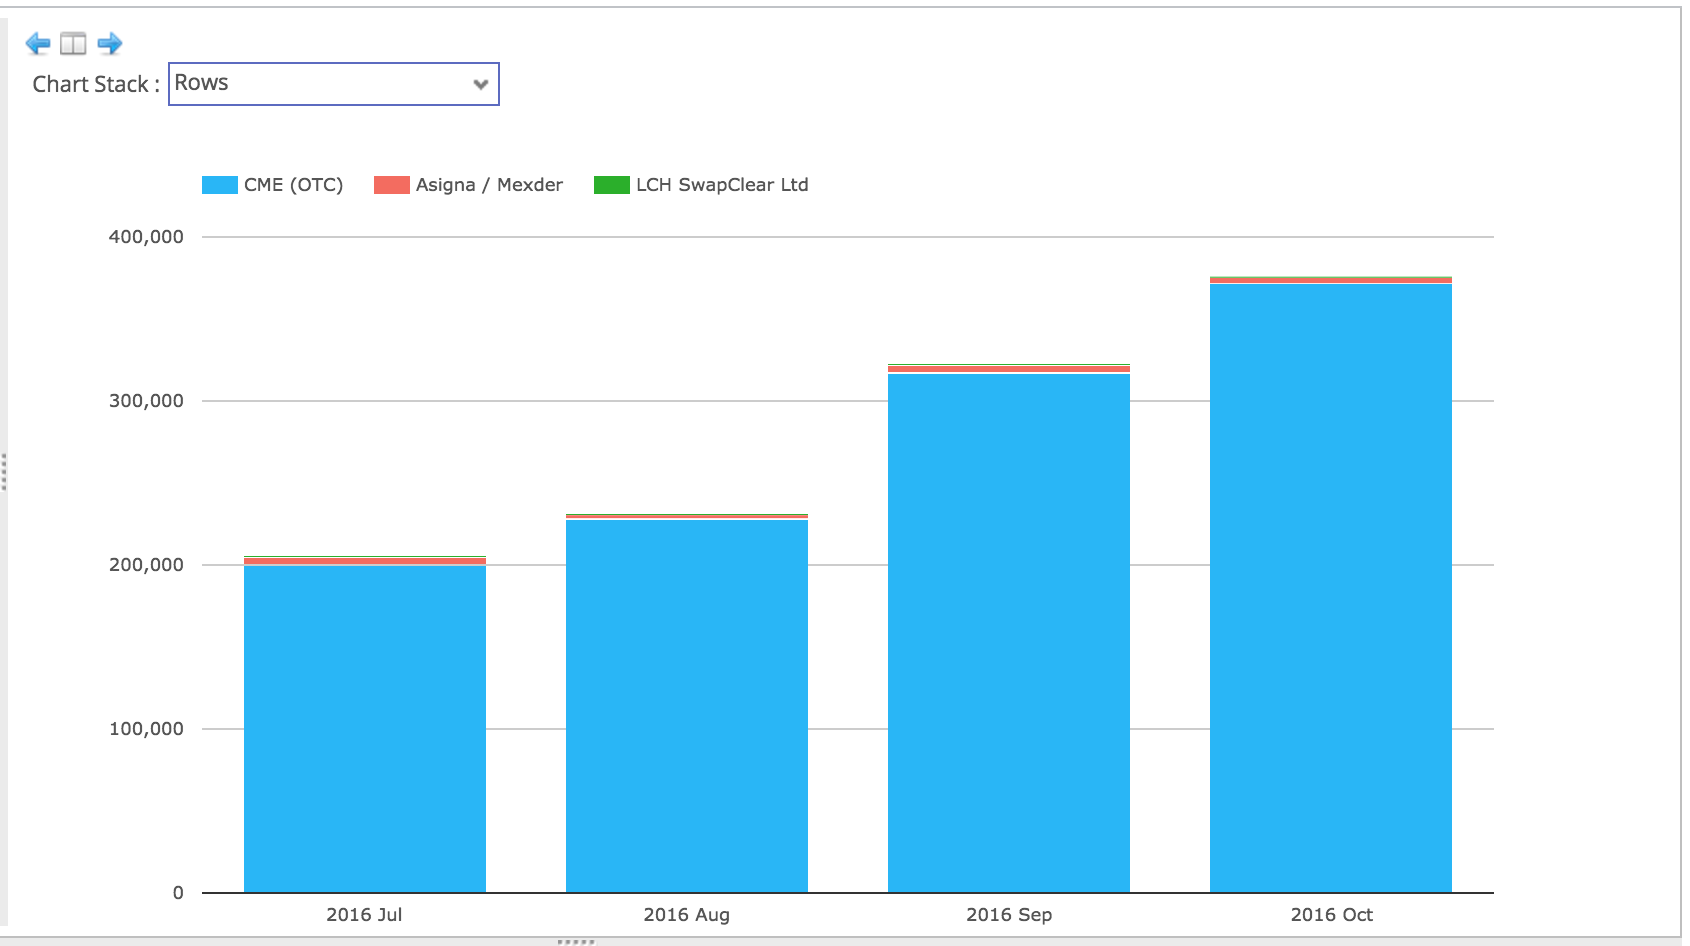
Showing:
- CME with $372 billion in October, up from $317 billion
- Asigna/Mexder at $3.9 billion down from $4.7 billion
- LCH SwapClear showing its first volume in MXN with $5 million
That’s it for today.
Thanks for staying to the end.
Our Swaps review series is published monthly.