The recent IOSCO report on Post-Trade Transparency in the Credit Default Swap Market, certainly makes interesting reading and in this blog I will provide a short summary of the report as well as looking in more depth at the data now available for CDS Index.
IOSCO Report
The report focus is on regulatory systems that mandate disclosure of information (widely accessible to the public), about the price and volume of each relevant transaction.
Currently only the CFTC in the US has implemented such a system for Index based products. The SEC has rules for single-name products but currently no compliance schedule, Canada will start end July 2016, Europe in January 2017 and in Japan ETPs are required to do so in September 2015.
IOSCO analyses the impact of mandatory post-trade transparency in CDS by comparing the period before and the period after the CFTC mandatory post-trade transparency rules, so 2011-12 and 2012-13. It does so using the data reported to the DTCC-TIW.
IOSCO concludes that the data does not suggest that the introduction of mandatory post-trade transparency had a substantial effect on market risk exposure or market activity for the CDS market.
The report includes a review of academic literature and a survey of market participant observations.
IOSCO identifies potential benefits and costs.
Benefits include: may promote efficient price discovery, enhance liquidity, improve valuations, help integrate a fragmented market and complement regulatory reporting.
Costs include: may reduce liquidity, operational costs, increased volatility, loss of confidence in positions.
IOSCO considering these, believes that greater post-trade transparency in the CDS market – including making the price and volume of individual transactions publicly available – would be valuable to market participants and other market observers.
IOSCO encourages each member jurisdiction to take steps towards enhancing post-trade transparency.
Links to the IOSCO Media Release and the Full Report for those of you interested in the detail.
Clarus View
This is one of the first reports that I have seen from supervisory bodies that specifically looks at the effect of public dissemination of trade level price and volume data.
So it is gratifying to see that IOSCO encourages each jurisdiction to take steps towards enhancing post-trade transparency.
As we have pointed out in a number of blogs, all non-US jurisdictions have yet to implement anything like the CFTC post-trade transparency regime; see Europe, Canada, Japan, Australia. So it is great to see a call for this from IOSCO.
The benefits of transparency to us are obvious: better price discovery, less asymmetry of information, leading to a more efficient market with greater competition and liquidity. Just as we have seen in the US Corporate Bond market after the introduction of TRACE.
I could go on listing and explaining, but why not just look at some data.
That way you can form your own view.
Deep Dive into CDS Index data
Using SDRView, which sources CDS Index data from the US SDRs at DTCC, BSDR and ICE, lets look at the most recent business day, August 21, 2015 and USD ON SEF Cleared trades in the major contracts.
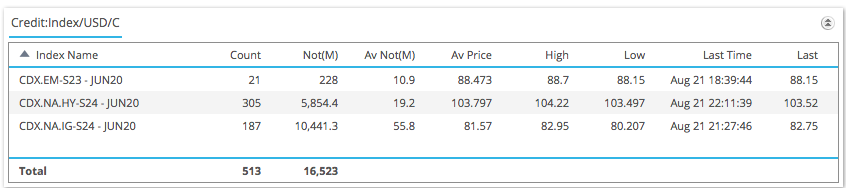
Showing that:
- CDX NA IG (Investment Grade) is the highest volume in gross notional terms with >$10.4 billion traded
- CDX NA IG has 187 reported trades with average notional $56m and a High Price of 82.95 and Low of 80.207
- CDX NA HY (High Yield) is the next highest with >$5.9 billion gross notional and 305 trades
- CDX EM (Emerging Market) has 21 trades with >$200 million gross notional
- (Remember capped trade rules mean the true volume is higher)
And drill-down on CDX.NA.IG.
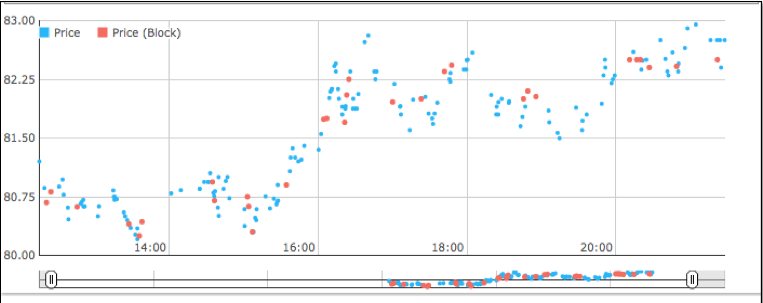
Showing each trade print with prices vs Lon time, charting how the price moved up from 80.75 level to an 82.75 level.
And then drill-down to a single trade print:
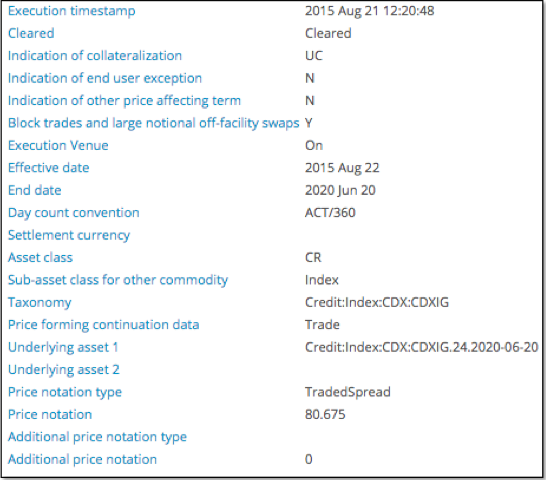
Interesting data to say the least.
And a very different level of detail than that available on aggregate volumes in the Trade Information Warehouse.
Noteworthy Stats
Regular readers of our blog will know that we often look at the Cleared vs Uncleared and On SEF vs Off SEF percentages for product types. The last time I looked at this for CDSIndex was in Aug 2014, see CDSIndex Volumes: A Year to Date Review.
In that I noted that for CDX.NA.IG in July 2014:
- On SEF Cleared was 86% of total volume
- Off SEF Cleared was 8%
- Off SEF Uncleared was 6%
The same data for July 2015.
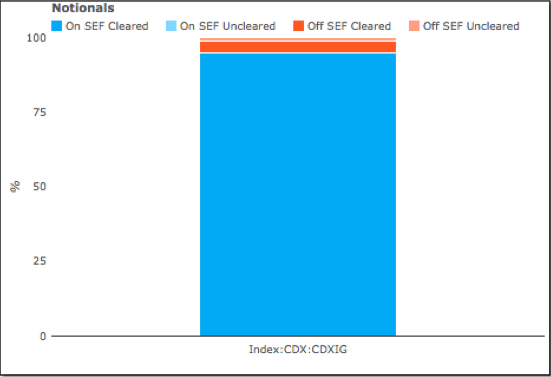
Showing that:
- On SEF Cleared has increased from 86% to 95%
- Off SEF Cleared has decreased from 8% to 4%
- Off SEF Uncleared has decreased from 6% to 1%.
So for US persons in July 2015, only 1% of gross notional volume was Uncleared. Excellent progress in the year.
Outstanding Gross Notional
As the vast majority of July volume in CDX.NA.IG is in the current Series 24, which started trading in March 2015 and most positions will have been rolled from the prior Series 23, we would expect not only the Volume but also the Outstanding Gross Notional to have a high cleared percentage.
Lets see whether we can verify this.
The CFTC Weekly Swaps Report gives an in-sight into this, with the current report (as of 7 August 2015) shown below.
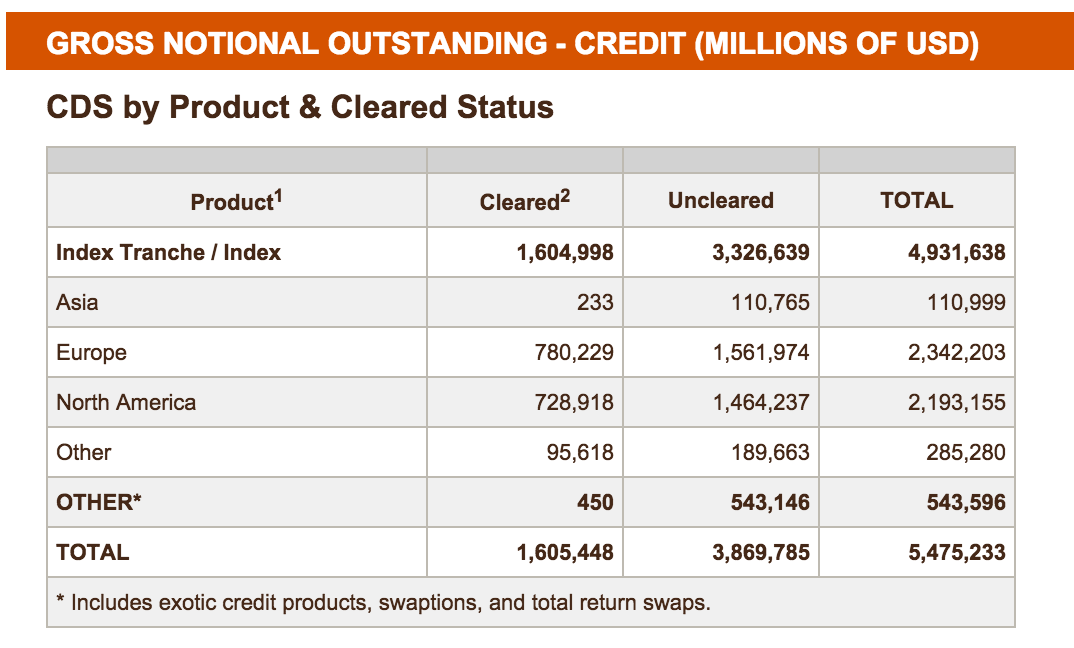
Showing that:
- North America Index Cleared is $729 billion, while Uncleared is $1.464 trillion
- Or Cleared is 33% and Uncleared 67%
- Surprising given the 99% Cleared figure we saw for trading volume in July
- Granted that was only CDX.NA.IG, while this is all North American Indices and includes Tranche products
- And also legacy positions put on before the Clearing mandate (that have not matured or been rolled)
- But is that likely to make that much difference?
- I would have thought not as CDX.NA.IG Index should dominate the gross notional amount
Splitting by Participant type.
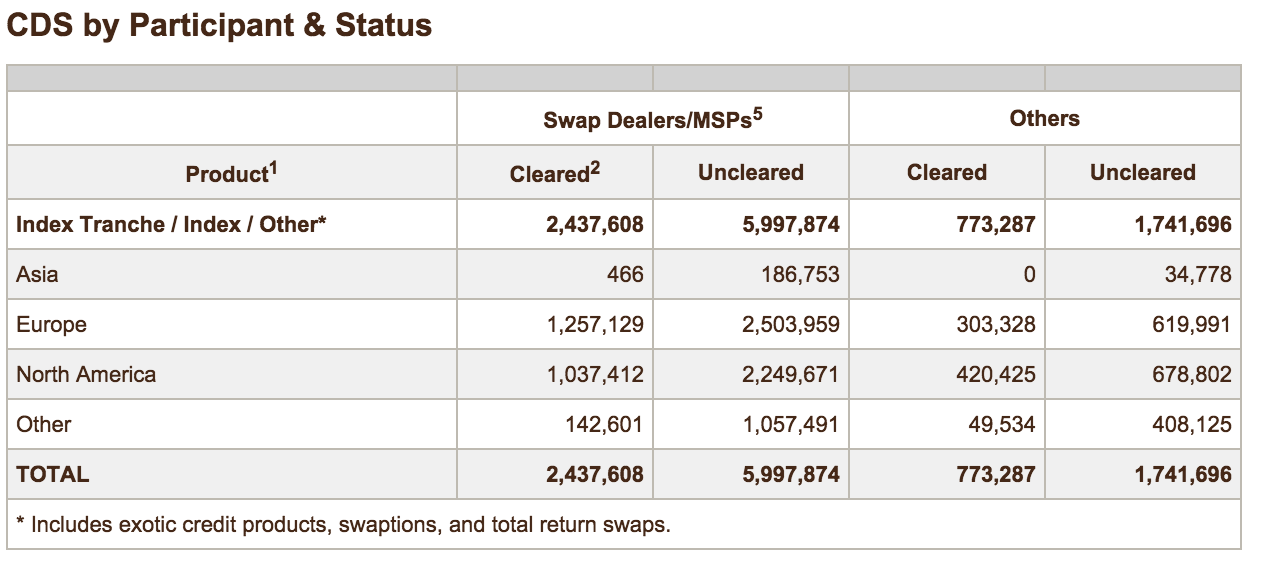
Showing that Swap Dealers/MSPs Cleared is 31.5% and Others is 38%.
So it is not participant types that are exempt from Clearing. Meaning it can only be other Indices or Tranched products or Legacy trades that account for the difference. But that is a guess. If anyone reading this knows the reason, please add a comment below or email us.
Not having access to a more detailed report just for CDX.NA.IG.S-24, we cannot be sure on the figure of Outstanding Notional Cleared percentage to compare with our Traded Volume Cleared Percentage.
What other data source can we turn to?
CCPView and TIW
Well in CCPView we have access to Global Cleared Volume as reported by Clearing Houses and TIW has Global Volumes. Both have data down to CDX.NA.IG.S-24 so we are in luck. Lets see what these shows.
First CCPView for 31 Jul 2015.
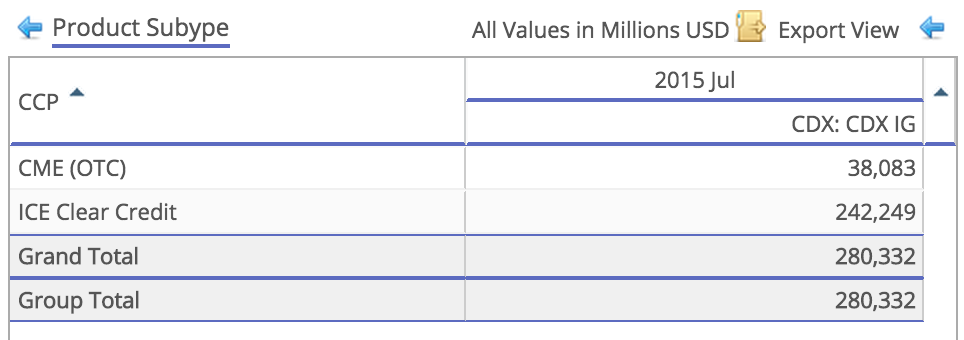
Showing that for all CDX.NA.IG series and contracts, outstanding cleared gross notional is $280 billion.
If we drill-down to just CDX.NA.IG.S24 and all dates (3Y, 5Y, 7Y, 10Y) we would get a total of $105 billion.
Next TIW.
Using Table 7, we see that for week ending 7 Aug 2015, CDX.NA.IG.S24 Gross Notional is $134.6 billion.
Giving us a Cleared Percentage of 78%.
Much more like it and seemingly consistent with the 99% Cleared for US persons in July, given that Clearing is not yet mandatory for this Index in Europe and other jurisdictions.
(Note we could repeat the above using CCPView data for 7 Aug 2015, but it makes very little difference).
Summary
Thats it for today and a quick summary.
IOSCO believes that greater post-trade transparency in the CDS market, including price and volume of individual transactions, would be valuable to market participants and other market observers.
IOSCO encourages each member jurisdiction to take steps towards enhancing post-trade transparency.
US CFTC rules for Swap Data Repositories are the only current implementation of public dissemination of transaction level price and volume data.
The transparency benefits of this, are different from and far greater than, the pre-regulatory reform repositories such as the DTCC Trade Information Warehouse.
Lets hope that regulators in non-US jurisdictions get the message and implement similar rules.
Not to do so would be a missed opportunity.